. 2014 Dec;32(12):1213-22.
doi: 10.1038/nbt.3052. Epub 2014 Nov 17.

A community computational challenge to predict the activity of pairs of compounds

Collaborators, Affiliations

A community computational challenge to predict the activity of pairs of compounds

Mukesh Bansal et al. Nat Biotechnol. 2014 Dec.

Abstract

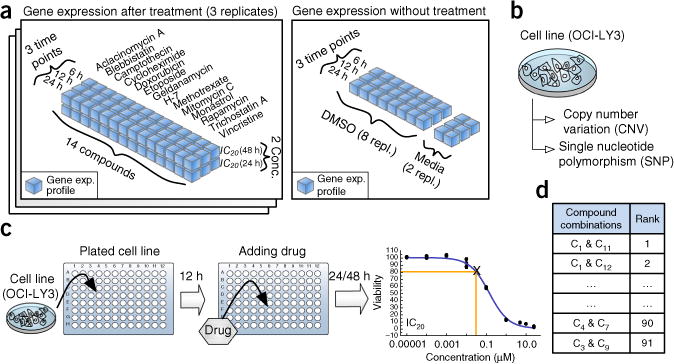
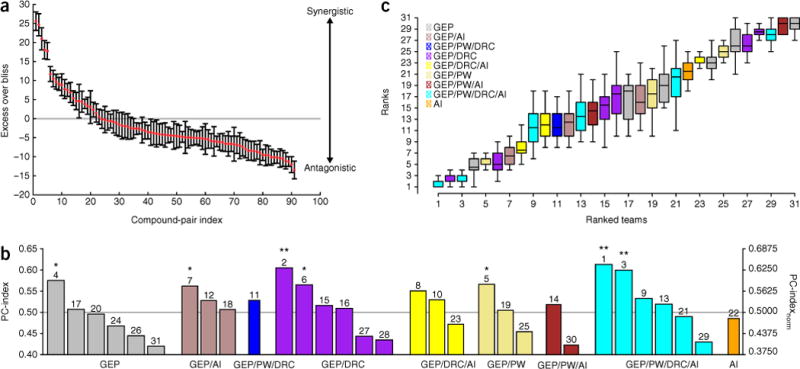
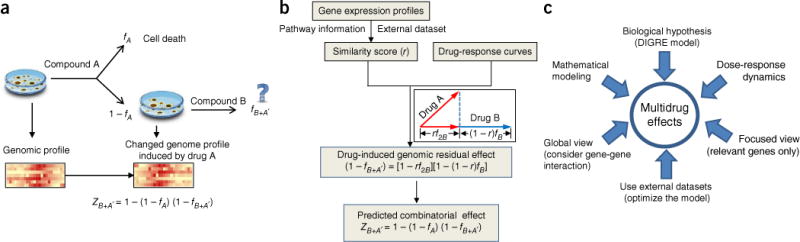
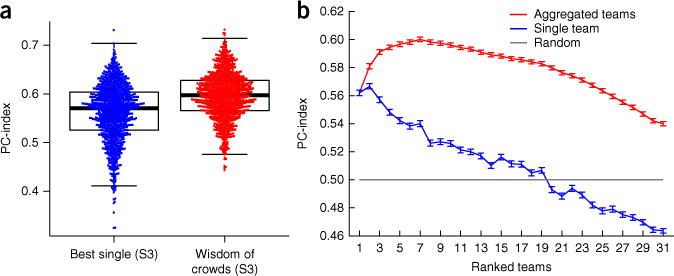
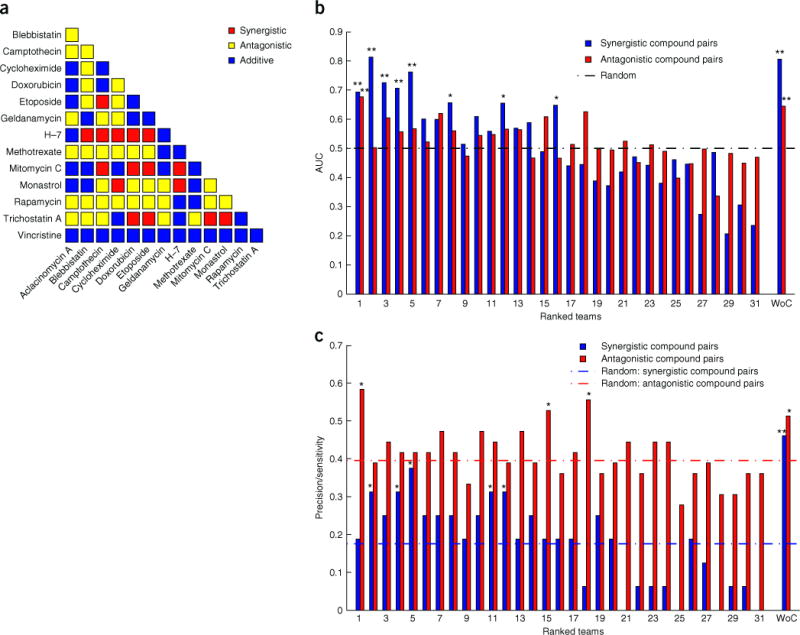
Recent therapeutic successes have renewed interest in drug combinations, but experimental screening approaches are costly and often identify only small numbers of synergistic combinations. The DREAM consortium launched an open challenge to foster the development of in silico methods to computationally rank 91 compound pairs, from the most synergistic to the most antagonistic, based on gene-expression profiles of human B cells treated with individual compounds at multiple time points and concentrations. Using scoring metrics based on experimental dose-response curves, we assessed 32 methods (31 community-generated approaches and SynGen), four of which performed significantly better than random guessing. We highlight similarities between the methods. Although the accuracy of predictions was not optimal, we find that computational prediction of compound-pair activity is possible, and that community challenges can be useful to advance the field of in silico compound-synergy prediction.


Conflict of interest statement

COMPETING FINANCIAL INTERESTS

The authors declare no competing financial interests.

Figures

Figure 1
Figure 1
Overview of data sets used in the NCI-DREAM compound-pair activity challenge. (a) Gene expression profiles of baseline samples, DMSO-treated and 14 single compound–treated samples are generated at three different time points (6, 12 and 24 h) and two different compound concentrations (IC20 at 24 and 48 h, where IC20 is defined as the compound concentration that kills 20% of cells). Compound-treated samples were generated in triplicate, baseline samples in duplicate and DMSO-treated samples in octuplicate. (b) The baseline genetic profile of the OCI-LY3 cell line obtained previously was provided to the participants. (c) Participants were also provided with the dose-response curve following single treatment. The curves were derived from a single-agent treatment of OCI-LY3 for the indicated time. X represents IC20 concentration of a compound. (d) Participants were required to rank each of the 91 pairwise compound combinations of 14 compounds from the most synergistic to the most antagonistic. Any additional data derived by participants through analysis of the literature were considered admissible in the challenge. Assays to experimentally test compound synergy, even in a limited format, were expressly prohibited.
Figure 2
Figure 2
Gold standard data for evaluation and performance of predictions. (a) The results of excess over Bliss for all compound pairs ranked from most synergistic to most antagonistic. Error bars represent the s.e.m. of excess over Bliss, estimated from five experimental replicates. The solid gray line at excess over Bliss equals 0 and represents a line over and below which compound pairs are generally considered synergistic and antagonistic, respectively. (b) PC-index for all participants grouped by the kind of data or information used by their method. There is no apparent correlation between the final score with the kind of data or information used. AI, additional information other than pathway information used; DRC, dose-response curve used; GEP, gene expression profile used; PW, pathway information used. The rank of each team is reported on the top of the bar. The gray line represents random performance. The y axis on right shows the PC-indexnorm where PC-index is normalized to have a score between 0 and 1. *FDR ≤ 0.20; **FDR ≤ 0.05. (c) Box plot showing the median, quartile and range of ranks for each team in leave-one-out test. All teams are sorted by their PC-index. Teams are color coded with the kind of data or information used by their methods.
Figure 3
Figure 3
The DIGRE model. (a) Biological hypotheses of the DIGRE model submitted by the best-performing team. The combined compound effect for compounds A and B is hypothesized to result from the compound-induced genomic residual effect. If cells were treated by compounds A and B sequentially, the genomic changes induced by compound A will further contribute to the effect induced by compound B. Here, fX denotes the percentage of cells killed by compound X and fB+A represents the cell viability reduction after B treatment, following the transcriptional changes induced by A. Based on this hypothesis, the estimation of the combinatorial compound effect (ZB+A) reduces to the estimation of the compound-induced genomic residual effect (fB+A’) (Supplementary Note 2). (b) Workflow of DIGRE. (Step 1) The genomic or transcriptome changes induced by two compounds are compared. The similarity score is refined by using pathway information and an external training data set. (Step 2) A mathematical model incorporates the similarity score and the dose-response curves to estimate the compound-induced genomic residual effect. (Step 3) A combined score is estimated for each of the two possible sequential orders of treatment and finally the synergistic score is estimated as the average combined score obtained by two possible sequential orders of treatment. (c) Key ingredients of the DIGRE model.
Figure 4
Figure 4
Community predictions. (a) Bee Swarm plot showing the performance of ensemble models and single best model, inferred from over 1,000 different three-set splits (S1/S2/S3) of the 91 drug pairs in the challenge. The first set S1 was used to determine an order of performance. The second set S2 was used to choose the optimal number of top methods to aggregate to attain best performance of the aggregate. Finally, the last set S3, which was not used to choose the order of aggregation or the optimal number of predictions to aggregate, was used to determine the performance of the best method (according to set S1) and of the “wisdom of crowds” aggregate. The latter is consistently better than the former. (b) Average and standard error over the 1,000 splits shown in a of the PC-index as computed in set S3 of individual teams (blue) and aggregates of the top-performing teams (red). The order of the teams in the x axis was determined according to set S1, but the performance was evaluated in set S3. The gray solid line represents random performance. Error bar represents the s.e.m. of the PC-index.
Figure 5
Figure 5
Synergistic and antagonistic gold standard and predictions. (a) Activity of compound pairs after discretizing the gold standard data into three states based on signal-to-noise ratio for excess over Bliss. Red, synergistic; yellow, additive; blue, antagonistic. (b) Area under the ROC (AUC) for synergistic (red) and antagonistic (blue) compound pairs. Teams are ranked by their performance in the challenge. WoC, performance of the “wisdom of crowds.” Black horizontal dashed line shows the average performance of random predictions. *FDR ≤ 0.20; **FDR ≤ 0.05. (c) Precision and sensitivity for synergistic (red) and antagonistic (blue) compound pairs. Horizontal dashed line in red and blue shows random performance for synergistic and antagonistic compound pairs, respectively. WoC, performance of the “wisdom of crowds.” Teams are ranked by their performance in the challenge. *P ≤ 0.05; **FDR ≤ 0.20.

References

    1. Rawlinson R, Massey AJ. Gamma H2AX and Chk1 phosphorylation as predictive pharmacodynamic biomarkers of Chk1 inhibitor-chemotherapy combination treatments. BMC Cancer. 2014;14:483. - PMC - PubMed
    1. Ibrahim YH, et al. PI3K inhibition impairs BRCA1/2 expression and sensitizes BRCA-proficient triple-negative breast cancer to PARP inhibition. Cancer Discov. 2012;2:1036–1047. - PMC - PubMed
    1. Yonesaka K, et al. Activation of ERBB2 signaling causes resistance to the EGFR-directed therapeutic antibody cetuximab. Sci Transl Med. 2011;3:99ra86. - PMC - PubMed
    1. Al-Lazikani B, Banerji U, Workman P. Combinatorial drug therapy for cancer in the post-genomic era. Nat Biotechnol. 2012;30:679–692. - PubMed
    1. Keith CT, Borisy AA, Stockwell BR. Multicomponent therapeutics for networked systems. Nat Rev Drug Discov. 2005;4:71–78. - PubMed

Publication types

Substances