. 2015 Jan;18(1):25-35.
doi: 10.1038/nn.3887. Epub 2014 Nov 24.

Selective conversion of fibroblasts into peripheral sensory neurons

Affiliations

Selective conversion of fibroblasts into peripheral sensory neurons

Joel W Blanchard et al. Nat Neurosci. 2015 Jan.

Abstract

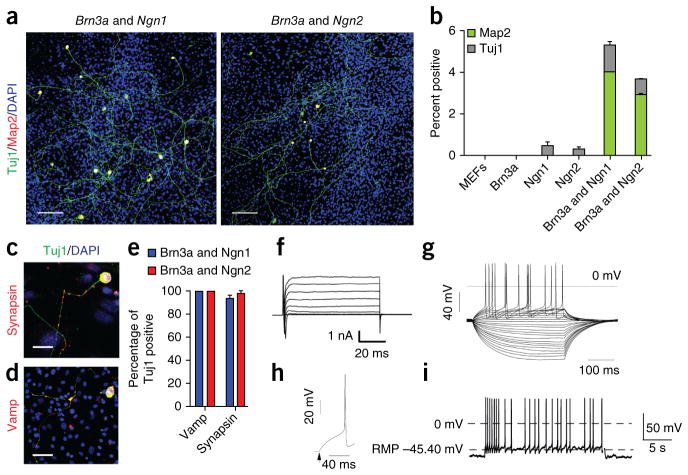
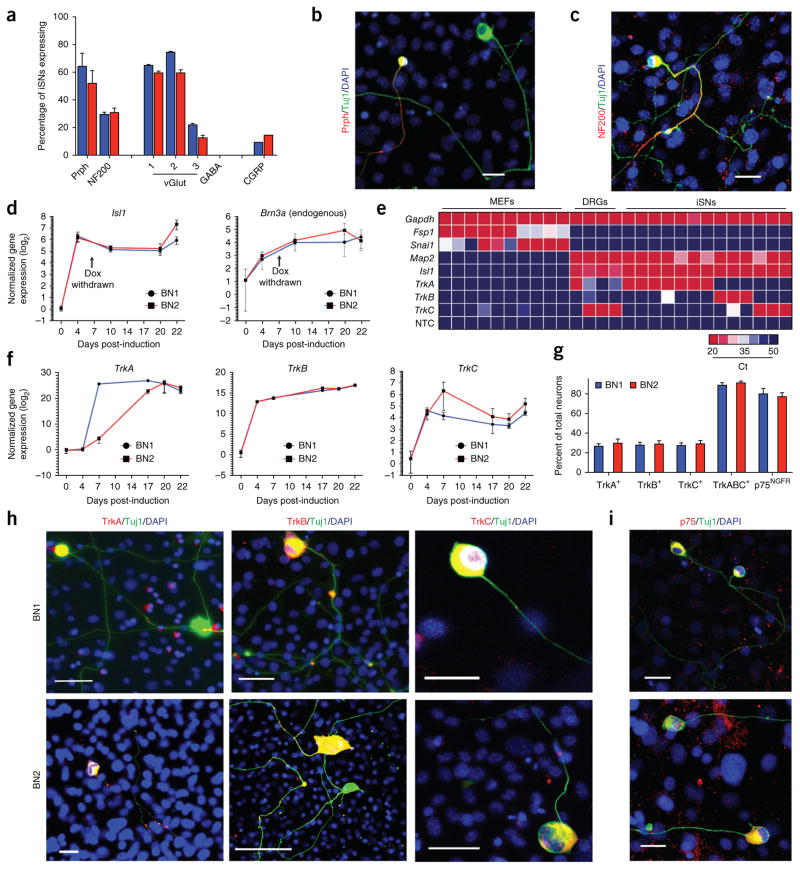
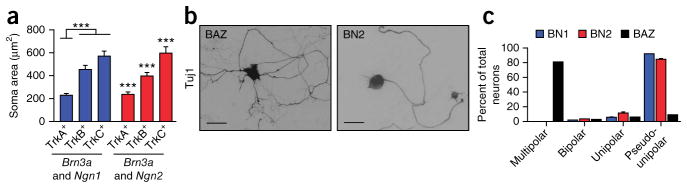
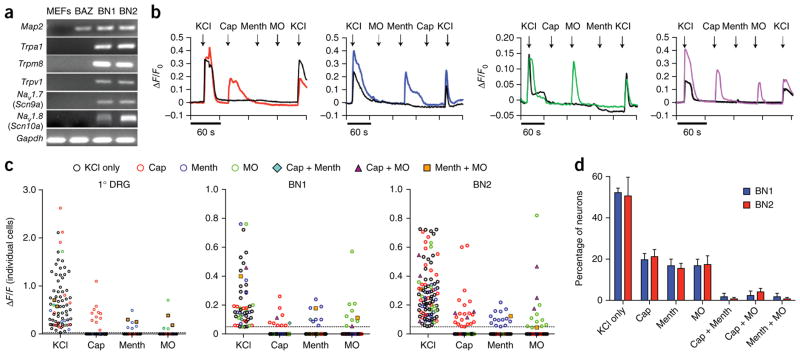
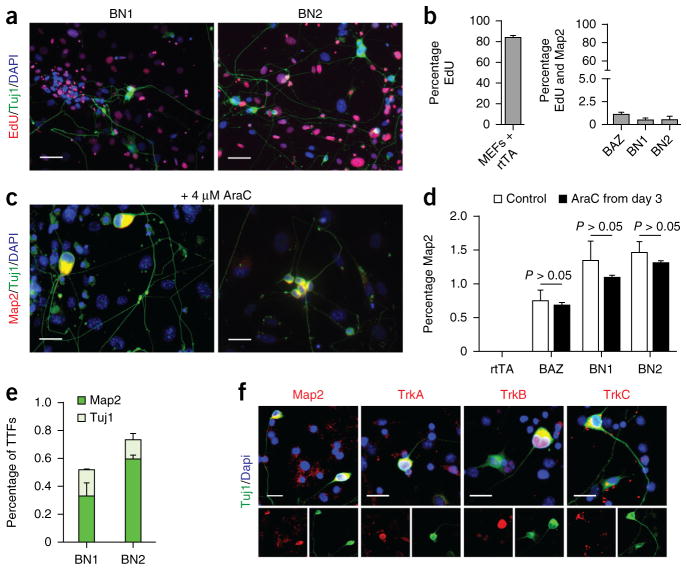
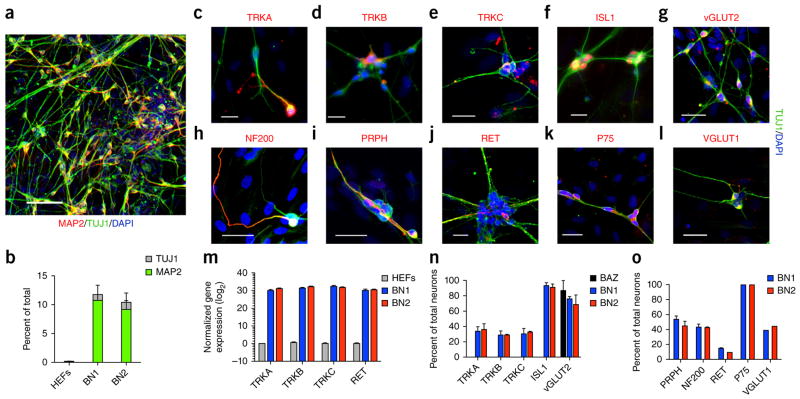
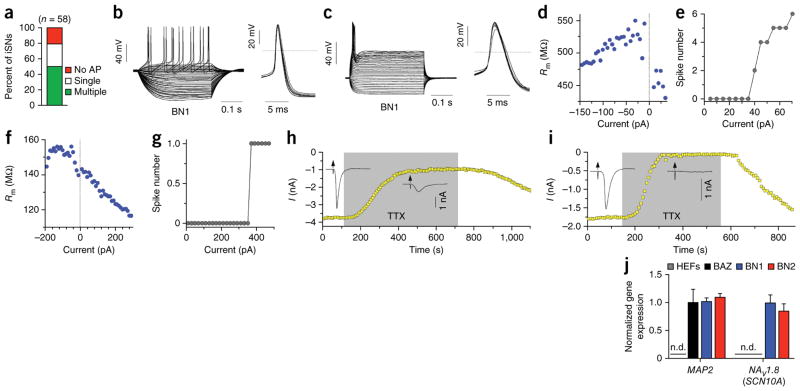
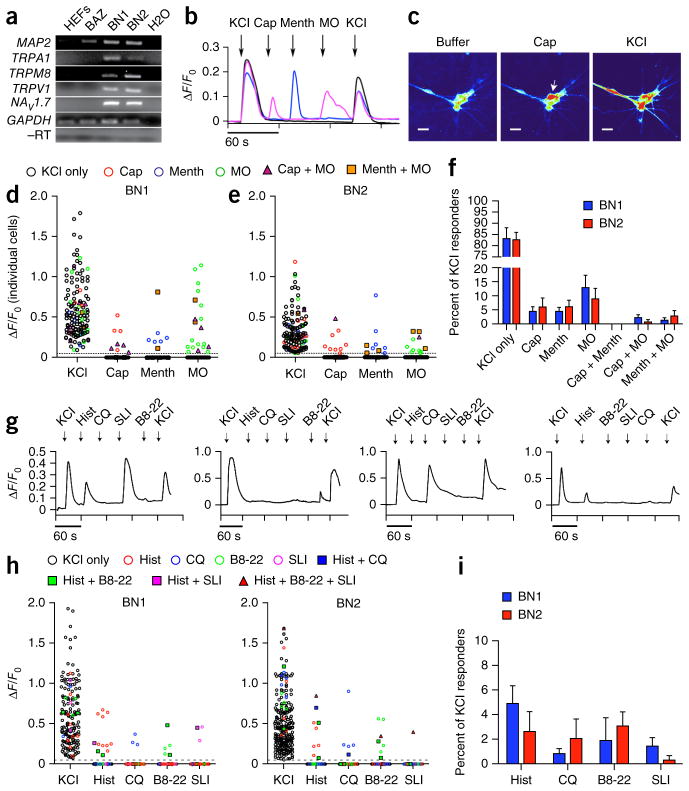
Humans and mice detect pain, itch, temperature, pressure, stretch and limb position via signaling from peripheral sensory neurons. These neurons are divided into three functional classes (nociceptors/pruritoceptors, mechanoreceptors and proprioceptors) that are distinguished by their selective expression of TrkA, TrkB or TrkC receptors, respectively. We found that transiently coexpressing Brn3a with either Ngn1 or Ngn2 selectively reprogrammed human and mouse fibroblasts to acquire key properties of these three classes of sensory neurons. These induced sensory neurons (iSNs) were electrically active, exhibited distinct sensory neuron morphologies and matched the characteristic gene expression patterns of endogenous sensory neurons, including selective expression of Trk receptors. In addition, we found that calcium-imaging assays could identify subsets of iSNs that selectively responded to diverse ligands known to activate itch- and pain-sensing neurons. These results offer a simple and rapid means for producing genetically diverse human sensory neurons suitable for drug screening and mechanistic studies.


Conflict of interest statement

COMPETING FINANCIAL INTERESTS

The authors declare no competing financial interests.

Figures

Figure 1
Figure 1
Transient coexpression of two developmentally relevant transcription factors stably reprograms fibroblasts to attain properties of functionally mature neurons. (a) Transient coexpression of Brn3a with either Ngn1 or Ngn2 for 8 d in fibroblasts induced cells with neural morphology that stained for the pan-neural markers Map2 (red) and Tuj1 (green) Cells were immunostained on day 14. Scale bars represent 100 μm. (b) Coexpression of Brn3a with Ngn1 or Ngn2 was required for induction of Map2 and Tuj1 double-positive cells. Transcription factors were induced for 8 d and immunostained on day 14. Data are presented as means ± s.e.m. from three independent replicates. n = 50,000 cells per genotype. (c) Synapsin expression (red) in BN2 neural cells. Cells were counterstained for Tuj1 (green). (d) Vamp (red) expression in BN1 neural cells. Scale bars in c and d represent 25 μm. (e) The majority of neurons induced with BN1 and BN2 expressed synaptic markers indicative of mature neurons (Vamp, (BN1 = 100%, n = 52, BN2 = 100%, n = 44; Synapsin, BN1 = 93.4%, n = 47, BN2 = 97.9%, n = 44). Data are presented as means ± s.e.m. from two independent experiments. (f) Whole-cell currents recorded in voltage-clamp mode. Inward fast-inactivating Na+ and outward currents were observed. (g) Representative subthreshold voltage responses and action potentials evoked from neural cells after 14 d in culture. Current pulses of 350-ms starting at −145 pA. (h) Representative single voltage spike isolated from trace in g measured at +95-pA current level. (i) Representative train of spontaneous action potentials observed in 14-d culture.
Figure 2
Figure 2
Neurons induced with BN1 or BN2 exhibit molecular hallmarks of the peripheral sensory neural lineage. (a) Quantification of neurofilament, neurotransmitter and neuropeptide expression in BN1 and BN2 neurons. Expression was assessed 20 d post induction via immunostaining (Prph, BN1 = 64.2%, n = 253, BN2 = 51.9%, n = 204; NF200, BN1 = 29.4%, n = 353, BN2 = 30.5%, n = 307; data are presented as means ± s.e.m. from four independent experiments; vGlut1, BN1 = 64.8%, n = 57, BN2 = 59.5%, n = 52; vGlut2, BN1 = 74.5%, n = 129, BN2 = 59.4%, n = 123; vGlut3, BN1 = 21.9%, n = 138, BN2 = 12.4%, n = 158; GABA, BN1 = 0%, n = 238, BN2 = 0%, n = 243; CGRP, BN1 = 9.1%, n = 99, BN2 = 14.3%, n = 91; data are presented as means ± s.e.m. from two independent experiments). (b) A subset of neurons induced via BN1 or BN2 expressed the Prph (red). Scale bar represents 25 μm. (c) A subset of neurons induced via BN1 or BN2 expressed the peripheral neurofilament NF200 (red). Scale bar represents 25 μm. (d) Time course of quantitative RT-PCR analysis of Isl1 and endogenous Brn3a expression following induction of Brn3a and Ngn1 (blue) or Brn3a and Ngn2 (red). Fold induction was calculated as the increase in expression from un-induced fibroblasts cultured for the same duration in the same conditions for each time point. Dox was withdrawn permanently 8 d post-induction as indicated by the arrows. (e) Single-cell real-time RT-PCR of iSNs on day 20. NTC, no template control. (f) Fold induction of TrkA, TrkB and TrkC following induction of Brn3a and Ngn1 (blue) or Brn3a and Ngn2 (red). Fold induction was calculated as the increase in expression from un-induced fibroblasts cultured for the same duration in the same conditions for each time point. (g) Quantification of neurons expressing p75Ngf and each of the three Trk receptors individually or combined (TrkA, BN1 = 26.8%, n = 72, BN2 = 29.6%, n = 100; TrkB, BN1 = 27.6%, n = 146, BN2 = 29.0%, n = 178; TrkC, BN1 = 27.3%, n = 102, BN2 = 28.9%, n = 113; TrkABC, BN1 = 88.9%, n = 182, BN2 = 91.9%, n = 156; p75NGFR, BN1 = 80.3%, n = 86, BN2 = 79.9%, n = 117). Data are presented as means ± s.e.m. from two independent experiments. (h) Representative immunostaining for TrkA, TrkB and TrkC 20 d post-induction. (i) p75Ngf immunostaining 20 d post induction. Scale bars in h and i represent 25 μm.
Figure 3
Figure 3
Reprogramming induces peripheral sensory neural morphology. (a) TrkA-, TrkB- and TrkC-immunoreactive neurons had distinct distribution of soma size. Graph depicts mean soma areas by Trk expression (TrkA, BN1 = 231 μm2, n = 56, BN2 = 238 μm2, n = 49; TrkB, BN1 = 456 μm2, n = 40, BN2 = 397 μm2, n = 47; TrkC, BN1 = 569 μm2, n = 40, BN2 = 598 μm2, n = 36). Error bars represent ±s.e.m. ***P < 0.001 (Kruskal-Wallis test) from two independent experiments (BN1: TrkA to TrkB, P = 1.8 × 10⁻⁸; TrkA to TrkC, P = 2.67 × 10⁻¹⁰; TrkB to TrkC, P = 0.072; BN2: TrkA to TrkB, P = 7.03 × 10⁻⁷; TrkA to TrkC, P = 5.39 × 10⁻¹⁰; TrkB to TrkC, P = 0.000916). (b) Typical morphology of pseudounipolar cells induced by BAZ and BN1 and BN2. Scale bars represent 100 μm. (c) The majority of Map2-, Tuj1-positive cells induced via Brn3a and Ngn1 or Brn3a and Ngn2 were pseudounipolar. Shown is the quantification of the neural morphologies observed in a representative experiments 14 d post-induction (multipolar, BN1 = 0%, BN2 = 0%, BAZ = 81.3%; bipolar, BN1 = 1.9%, BN2 = 3.4%, BAZ = 6.2%; unipolar, BN1 = 6.1%, BN2 = 11.2%, BAZ = 3.1%; pseudounipolar, BN1 = 92.0%, BN2 = 84.7%, BAZ = 9.3%). BN1, n = 212; BN2, n = 206; BAZ, n = 132. Bars represent means from two independent experiments. Error bars represent s.e.m.
Figure 4
Figure 4
iSNs exhibit functional properties of sensory neurons. (a) RT-PCR analysis of MEFs, neurons induced with BAZ and iSNs generated with BN1 or BN2. Trpa1, Trpm8, Trpv1 and NaV1.7 were detected in BN1 and BN2 conditions, but not in MEFs or BAZ. Full-length images are shown in Supplementary Figure 12. (b) Representative calcium responses for 10 μM capsaicin (Cap), 100 μM menthol (Menth) and 100 μM mustard oil (MO). Populations of BN1 and BN2 iSNs responded to Cap (BN1, 19.7 ± 3.0%; BN2, 21.2 ± 3.5%), Menth (BN1, 15.4 ± 2.6%; BN2, 17.4 ± 4.3%) and MO (BN1, 12.9 ± 3.8%; BN2, 12.5 ± 3.4%). A smaller population responded to two ligands sequentially: Cap and Menth (BN1, 1.7 ± 1.7%; BN2, 0.7 ± 0.7%), Cap and MO (BN1, 2.3 ± 2.3%; BN2, 4.1 ± 1.7%), and Menth and MO (BN1, 1.7 ± 1.7%; BN2, 0.7 ± 0.7%). Calcium transients were measured using Map2::GCAMP5.G. Calcium responses were calculated as the change in fluorescence (ΔF) over the initial fluorescence (Fo). Depolarization with 25 mM KCl was used at the beginning and end of each experiment to confirm neural identity and sustained functional capacity. (c) ΔF/F0 intensity plot showing the response of individual cells to each ligand for primary DRG neurons (1° DRG, n = 78), BN1 (n = 50) and BN2 (n = 139) iSNs. Each cell is represented in each column. Cells responded to either KCl only (black circle), KCl plus one other ligand (colored circle) or KCl plus two other ligands (blue diamond, purple triangle or orange square). (d) Distribution of KCl responders that responded to either KCl only, KCl plus one other ligand or KCl with two other ligands. Data are presented as means ± s.e.m. from at least four experiments.
Figure 5
Figure 5
iSN reprogramming does not require proliferating or specialized embryonic precursor. (a) EdU and Map2 staining 14 d post induction. Scale bars represent 25 μm. (b) Quantification of the number of Map2-positive cells that co-stained for the mitotic indicator EdU. rtTA indicates MEFs infected with reverse tetracycline trans-activator. BAZ indicates MEFs infected with Brn2, Mash1 (also known as Ascl1) and Zic1, a previously reported transcriptional cocktail for the direct conversion of MEFs to neurons. Bar are means from two separate experiments. Error bars are s.e.m. For each condition, 50,000 cells were counted in three biological replicates. (c) BN1 and BN2 generated neurons in the presence of the mitotic inhibitor AraC. AraC was applied from 3 d post induction until the end of the experiment at 4 μM, a concentration empirically determined to inhibit >90% proliferative cells. Scale bars represent 25 μm. (d) No significant difference was observed in the number of Map2-positive neurons generated in the presence or absence of the mitotic inhibitor AraC (BAZ, P = 0.19; BN1, P = 0.49; BN2, P = 0.40). Bars are means of two independent experiments. Error bars are s.e.m. For each condition, 50,000 cells were counted in three biological replicates. (e) Quantification of Map2-, Tuj1-positive cells induced from tail-tip fibroblasts. n = 50,000 cells per genotype from two independent experiments. Error bars represent s.e.m. for each condition. (f) BN1 and BN2 induced neural cells from TTFs that stain for peripheral sensory markers. Scale bars represent 25 μm.
Figure 6
Figure 6
Human iSNs are generated using BN1 and BN2. (a) Expression of BN1 and BN2 converted HEFs into MAP2 and TUJ1 double-positive cells with neuronal morphologies 14 d after induction; dox was removed on day 8. Scale bar represents 100 μm. (b) Percentage of TUJ1-positive (gray) and MAP2 and TUJ1 double-positive (green) cells generated from HEFs in BN1, BN2 and rtTA control conditions. n = 50,000 cells per genotype from two independent experiments. (cl) Neurons induced with BN1 and BN2 expressed peripheral sensory markers. Scale bars represent 25 μm. (m) Quantitative RT-PCR of TRK receptors in MEFs and iSNs generated with BN1 or BN2. Expression levels are normalized to MAP2. Bars and error bars represent means and s.e.m. from two independent biological replicates. (n) Quantification of TUJ1-positive cells expressing TRKA, TRKB, TRKC, vGLUT2 and ISL1 in BN1, BN2, BAZ and rtTA control conditions (TRKA, BN1 = 33.6%, n = 109, BN2 = 35.8%, n = 131, BAZ = 0%, n = 52; TRKB, BN1 = 28.6%, n = 138, BN2 = 29.0%, n = 135, BAZ = 0%, n = 109; TRKC, BN1 = 30.0%, n = 44, BN2 = 23.3%, n = 98, BAZ = 0%, n = 101; ISL1, BN1 = 93.2%, n = 278, BN2 = 90.5%, n = 27, BAZ = 0%, n = 181; vGLUT2, BN1 = 75.9%, n = 135, BN2 = 68.6%, n = 166, BAZ = 86.7%, n = 121). Bars represent means and error bars represent s.e.m. from three independent experiments. (o) Quantification of TUJ1-positive cells expressing NF200, PRPH and RET in BN1 and BN2 (PRPH, BN1 = 53.4%, n = 141, BN2 = 44.5%, n = 169; NF200, BN1 = 42.8%, n = 70, BN2 = 42.1%, n = 126; RET, BN1 = 14.3%, n = 223, BN2 = 9.1%, n = 154; P75, BN1 = 100%, n = 120, BN2 = 100%, n = 120; VGLUT1, BN1 = 38.5%, n = 122, BN2 = 44.0%, n = 184). Error bars represent s.e.m. from two independent experiments.
Figure 7
Figure 7
Human iSNs display physiological properties of mature sensory neurons. (a) The observed frequency of iSNs types in all cells patched. (b,c) Representative traces from whole-cell patch-clamp recordings showing multiple-spiking (b) and single-spiking (c) type iSNs, with single action potentials shown to the right. (d,f) The input resistance of multiple-spiking (d) and single-spiking (f) iSNs plotted as a function of the injected current. (e,g) The number of action potentials fired at increasing levels of current for multiple-spiking (e) and single- spiking (g) iSNs. (h,i) Time course of inward current during perfusion with 100 nM TTX (gray area) and during wash out (white area). Insets are representative current traces before and during the TTX application. The effect was reversible in both cells. (j) iSNs selectively expressed the TTX-resistant sodium channel SCN10A. Expression of MAP2 and SCN10A in HEFs, BAZ iSNs and iSNs generated by BN1 and BN2 was measured by real-time RT-PCR from two independent experiments. Gene expression was normalized to BN1 iSNs. n.d. signifies undetectable expression of that gene. Error bars represent s.e.m. from three experiments.
Figure 8
Figure 8
Human iSNs possess functional properties of sensory neurons. (a) RT-PCR analysis showing presence of ligand gated calcium channels TRPA1, TRPM8, TRPV1 and the voltage-gated sodium channel NaV1.7 in BN1 and BN2 human iSNs compared with BAZ and uninfected controls (HEFs) at 16 d post induction. BN1, BN2 and BAZ samples expressed MAP2 compared with uninfected controls. TRPA1, TRPM8, TRPV1 and NaV1.7 were present only in BN1 and BN2. GAPDH amplification in samples provided the loading control, and GAPDH used in the reverse transcriptase–negative (−RT) control for contaminating genomic DNA. Full-length images are shown in Supplementary Figure 12. (b) Representative calcium responses for 10 μM capsaicin (Cap), 100 μM menthol (Menth), and 100 μM mustard oil (MO). Calcium transients were measured using Map2::GCAMP5.G. Calcium responses were calculated as the change in fluorescence (ΔF) over the initial fluorescence (Fo). Depolarization with 25 mM KCl was used at the beginning and end of each experiment to confirm neural identity and sustained functional capacity. (c) Screenshot images of GCAMP fluorescence in BN2 iSNs in response to the addition of buffer, 10 μM capsaicin (cap) and 25 mM KCl. Scale bars represent 25 μm. (d,e) ΔF/F0 intensity plot showing the response of individual cells to each ligand. Each cell is represented in each column. Cells respond to KCl only (black circle), KCl plus one other ligand (colored circle) or KCl plus two other ligands (triangle or square). (f) Distribution of ligand response in BN1 (n = 146) and BN2 (n = 138). Populations of iSNs responded to Cap (BN1, 4.4 ± 1.7%; BN2, 5.9 ± 3.3%), Menth (BN1, 4.4 ± 1.4%; BN2, 6.0 ± 2.3%) and MO (BN1, 12.8 ± 4.5%; BN2, 8.8 ± 3.7%), with small subpopulations responding to two ligands sequentially. iSNs responded to two ligands sequentially: Cap and MO (BN1, 3.2 ± 0.7%; BN2, 1.2 ± 1.2%), Menth and MO (BN1, 1.9 ± 1.9%; BN2, 1.1 ± 1.1%). The majority of KCl responsive iSNs did not respond to any of the three ligands (BN1, 83.1 ± 4.9%; BN2, 82.6 ± 3.4%). Bars represent means and error bars represent s.e.m. from seven independent experiments. (g) Representative calcium responses for 100 μM histamine (Hist), 100 μM chloroquine (CQ), 10 μM BAM8-22 (B8-22), 10 μM SLI-GRL (SLI). (h) ΔF/F0 intensity plots of three separate ligand combination regimes showing the response of individual cells to each ligand. Each cell is represented in each column. Cells responded to KCl only (black circle), KCl plus one other ligand (colored circle) or KCl plus two other ligands (triangle or square). (i) Distribution of ligand response in BN1 and BN2 to Hist (BN1, 4.8 ± 1.4%; BN2, 2.6 ± 1.6%), CQ (BN1, 0.8 ± 0.4%; BN2, 2.0 ± 1.6%), B8-22 (BN1, 1.8 ± 1.8%; BN2, 3.1 ± 1.1%), SLI (BN1, 1.5 ± 0.7%; BN2, 0.3 ± 0.3%), Hist and CQ (BN1, n = 288; BN2, n = 302), and B8-22 and SLI (BN1, n = 183; BN2, n = 234). Bars represent means and error bars represent s.e.m. from three independent experiments.

References

    1. Finnerup NB, Sindrup SH, Jensen TS. The evidence for pharmacological treatment of neuropathic pain. Pain. 2010;150:573–581. - PubMed
    1. Scholz J, Woolf CJ. Can we conquer pain? Nat Neurosci. 2002;5:1062–1067. - PubMed
    1. Koeppen AH, et al. The dorsal root ganglion in Friedreich’s ataxia. Acta Neuropathol. 2009;118:763–776. - PubMed
    1. Riera CE, et al. TRPV1 pain receptors regulate longevity and metabolism by neuropeptide signaling. Cell. 2014;157:1023–1036. - PubMed
    1. Dib-Hajj SD, Yang Y, Black JA, Waxman SG. The Na(V)1.7 sodium channel: from molecule to man. Nat Rev Neurosci. 2013;14:49–62. - PubMed

Publication types

MeSH terms