

Local slowdown of translation by nonoptimal codons promotes nascent-chain recognition by SRP in vivo
- PMID: 25420103
- PMCID: PMC4488850
- DOI: 10.1038/nsmb.2919
Local slowdown of translation by nonoptimal codons promotes nascent-chain recognition by SRP in vivo
Abstract
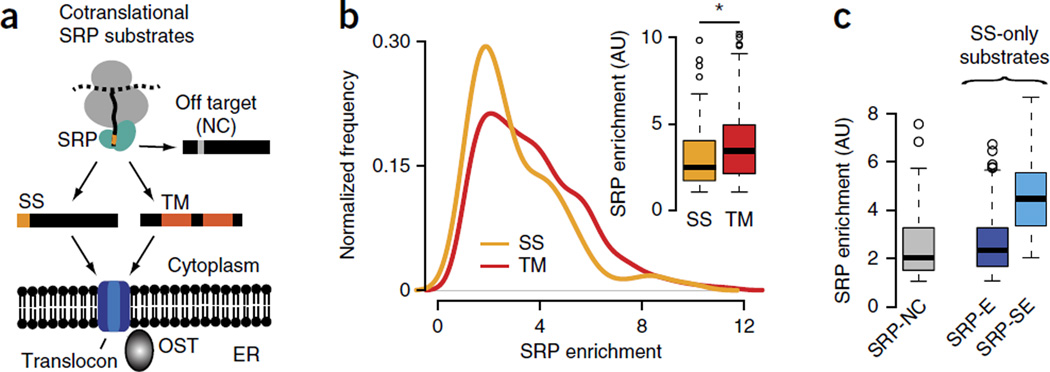
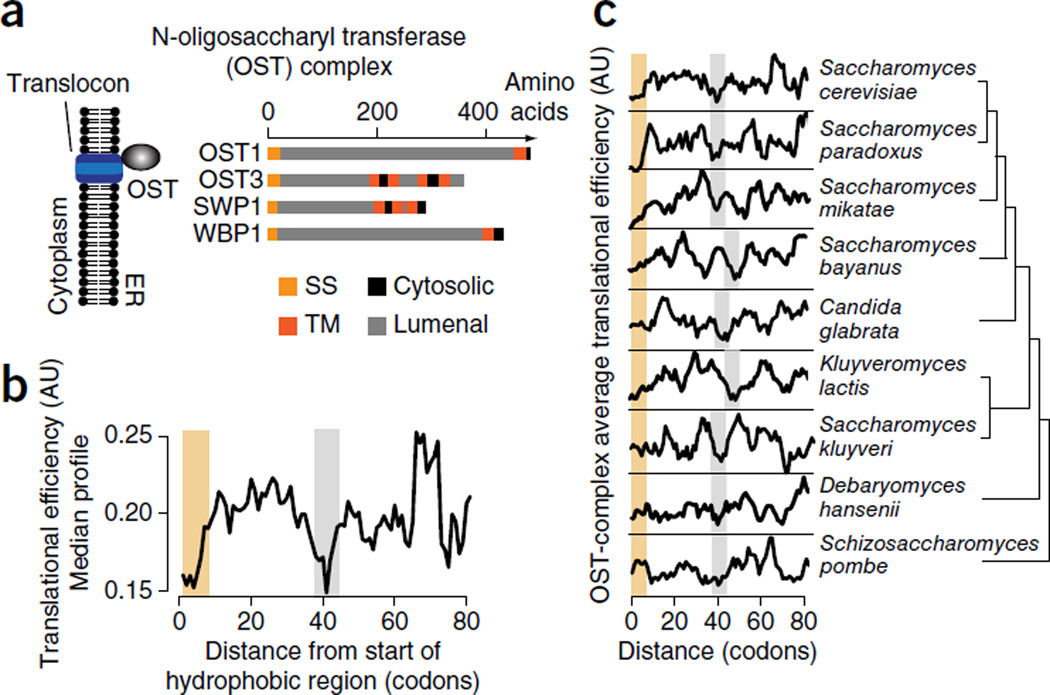
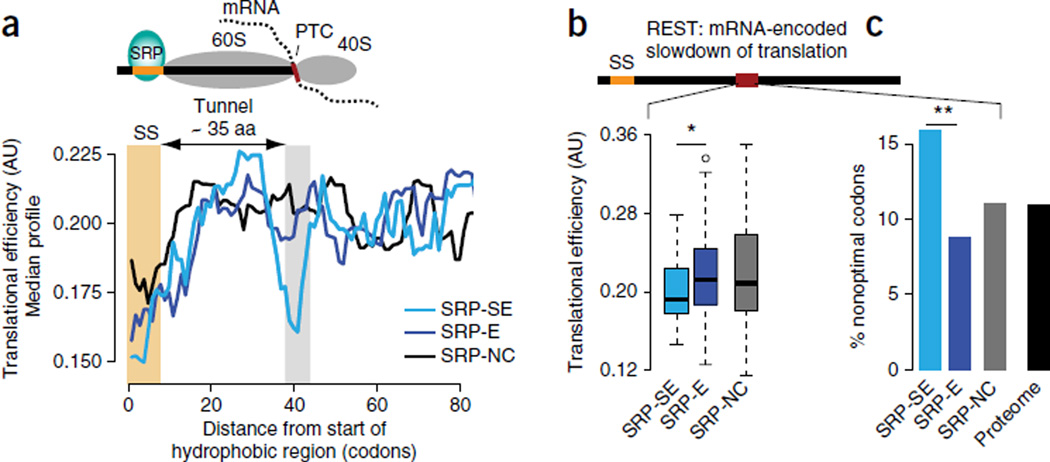
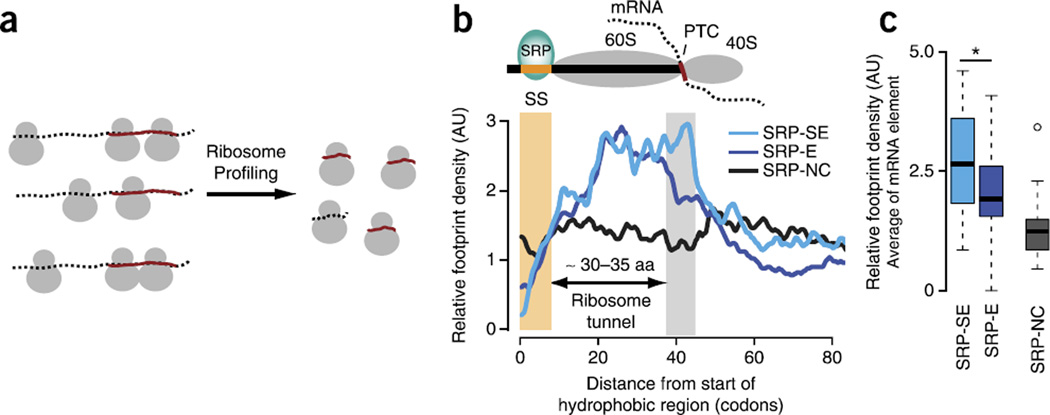
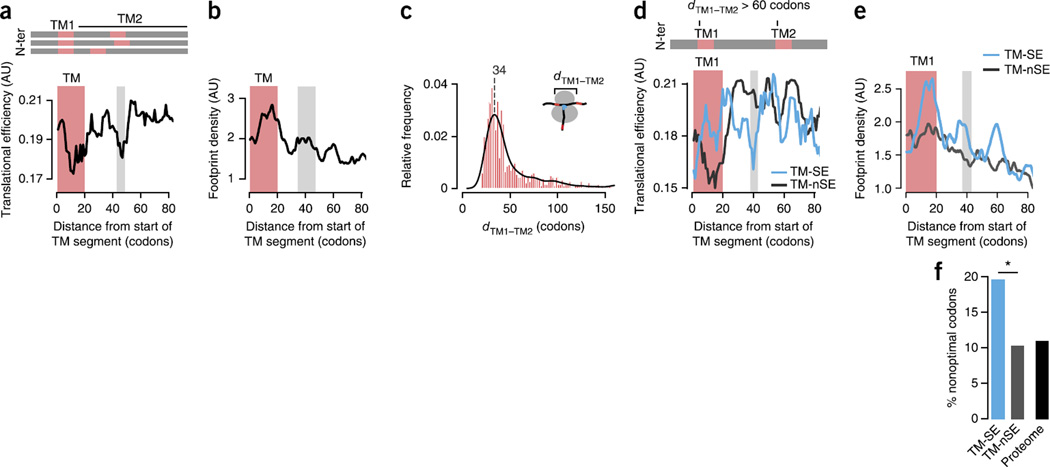
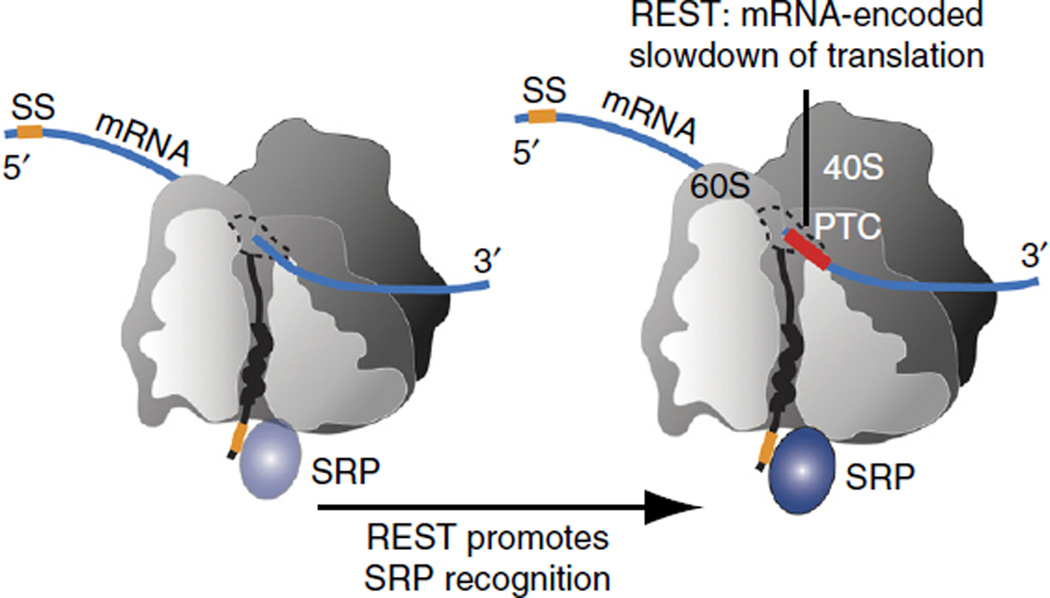
The genetic code allows most amino acids a choice of optimal and nonoptimal codons. We report that synonymous codon choice is tuned to promote interaction of nascent polypeptides with the signal recognition particle (SRP), which assists in protein translocation across membranes. Cotranslational recognition by the SRP in vivo is enhanced when mRNAs contain nonoptimal codon clusters 35-40 codons downstream of the SRP-binding site, the distance that spans the ribosomal polypeptide exit tunnel. A local translation slowdown upon ribosomal exit of SRP-binding elements in mRNAs containing these nonoptimal codon clusters is supported experimentally by ribosome profiling analyses in yeast. Modulation of local elongation rates through codon choice appears to kinetically enhance recognition by ribosome-associated factors. We propose that cotranslational regulation of nascent-chain fate may be a general constraint shaping codon usage in the genome.
Figures
Comment in
-
Optimizing membrane-protein biogenesis through nonoptimal-codon usage.Nat Struct Mol Biol. 2014 Dec;21(12):1023-5. doi: 10.1038/nsmb.2926. Nat Struct Mol Biol. 2014. PMID: 25469841 No abstract available.
-
Protein translocation: Slowly (translate) but surely (translocate).Nat Rev Mol Cell Biol. 2015 Jan;16(1):2-3. doi: 10.1038/nrm3921. Epub 2014 Dec 10. Nat Rev Mol Cell Biol. 2015. PMID: 25491102 No abstract available.
Similar articles
-
Cotranslational signal-independent SRP preloading during membrane targeting.Nature. 2016 Aug 11;536(7615):224-8. doi: 10.1038/nature19309. Epub 2016 Aug 3. Nature. 2016. PMID: 27487213 Free PMC article.
-
Global profiling of SRP interaction with nascent polypeptides.Nature. 2016 Aug 11;536(7615):219-23. doi: 10.1038/nature19070. Epub 2016 Aug 3. Nature. 2016. PMID: 27487212
-
Optimizing membrane-protein biogenesis through nonoptimal-codon usage.Nat Struct Mol Biol. 2014 Dec;21(12):1023-5. doi: 10.1038/nsmb.2926. Nat Struct Mol Biol. 2014. PMID: 25469841 No abstract available.
-
A Code Within a Code: How Codons Fine-Tune Protein Folding in the Cell.Biochemistry (Mosc). 2021 Aug;86(8):976-991. doi: 10.1134/S0006297921080083. Biochemistry (Mosc). 2021. PMID: 34488574 Free PMC article. Review.
-
SRP meets the ribosome.Nat Struct Mol Biol. 2004 Nov;11(11):1049-53. doi: 10.1038/nsmb853. Nat Struct Mol Biol. 2004. PMID: 15523481 Review.
Cited by
-
The Yin and Yang of codon usage.Hum Mol Genet. 2016 Oct 1;25(R2):R77-R85. doi: 10.1093/hmg/ddw207. Epub 2016 Jun 27. Hum Mol Genet. 2016. PMID: 27354349 Free PMC article. Review.
-
The stop-and-go traffic regulating protein biogenesis: How translation kinetics controls proteostasis.J Biol Chem. 2019 Feb 8;294(6):2076-2084. doi: 10.1074/jbc.REV118.002814. Epub 2018 Nov 30. J Biol Chem. 2019. PMID: 30504455 Free PMC article. Review.
-
Codon usage similarity between viral and some host genes suggests a codon-specific translational regulation.Heliyon. 2020 May;6(5):e03915. doi: 10.1016/j.heliyon.2020.e03915. Epub 2020 May 8. Heliyon. 2020. PMID: 32395662 Free PMC article.
-
Combinations of slow-translating codon clusters can increase mRNA half-life in Saccharomyces cerevisiae.Proc Natl Acad Sci U S A. 2021 Dec 21;118(51):e2026362118. doi: 10.1073/pnas.2026362118. Proc Natl Acad Sci U S A. 2021. PMID: 34911752 Free PMC article.
-
Correcting the F508del-CFTR variant by modulating eukaryotic translation initiation factor 3-mediated translation initiation.J Biol Chem. 2018 Aug 31;293(35):13477-13495. doi: 10.1074/jbc.RA118.003192. Epub 2018 Jul 13. J Biol Chem. 2018. PMID: 30006345 Free PMC article.
References
Publication types
MeSH terms
Substances
Grants and funding
LinkOut - more resources
Full Text Sources
Other Literature Sources
Medical
Molecular Biology Databases
