. 2014 Nov 24;9(11):e113120.
doi: 10.1371/journal.pone.0113120. eCollection 2014.

Genetic dissection of photoperiod response based on GWAS of pre-anthesis phase duration in spring barley

Affiliations

Genetic dissection of photoperiod response based on GWAS of pre-anthesis phase duration in spring barley

Ahmad M Alqudah et al. PLoS One. .

Erratum in

Abstract

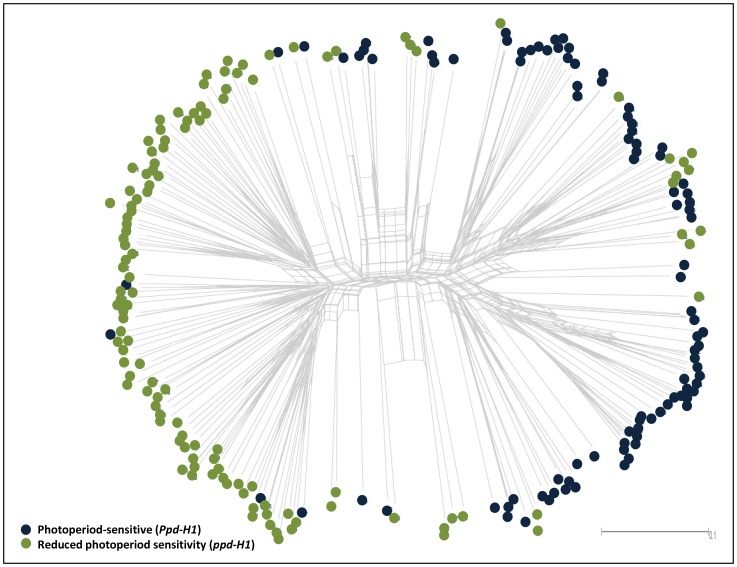
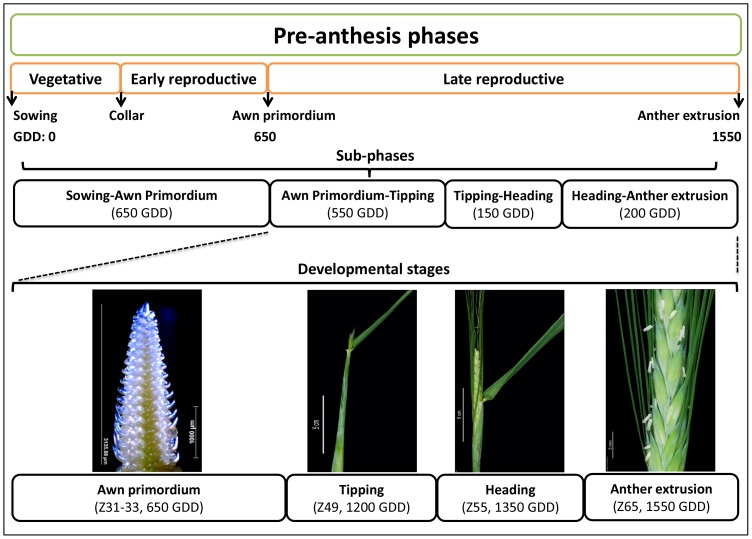
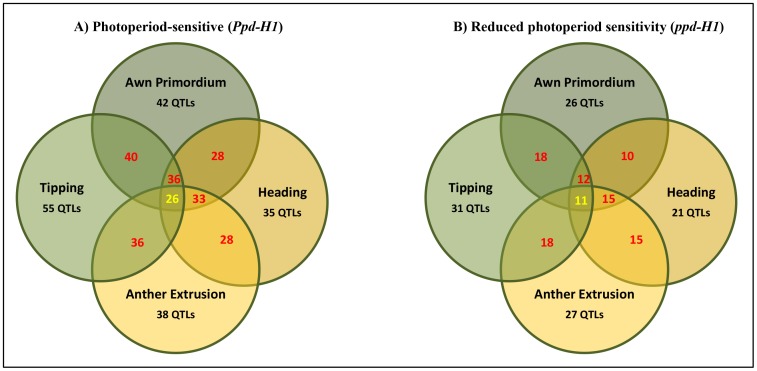
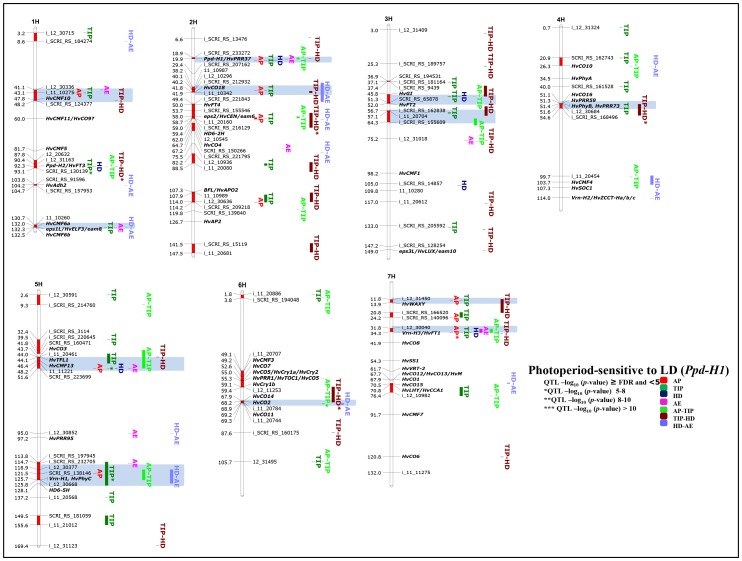
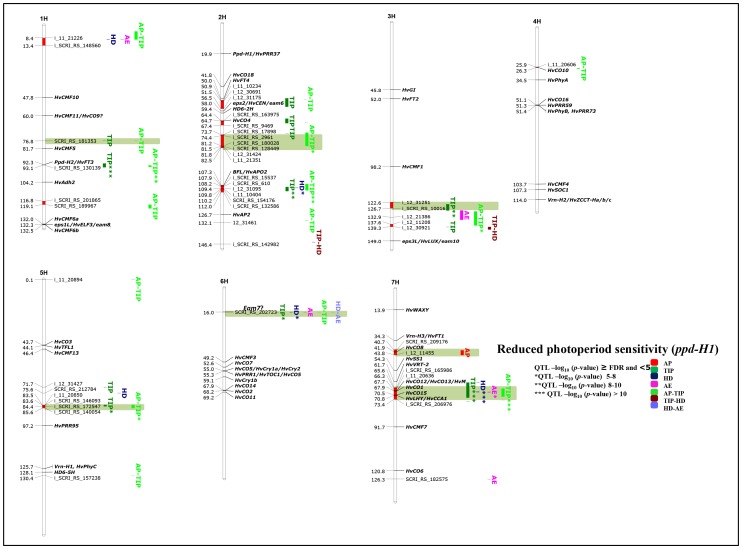
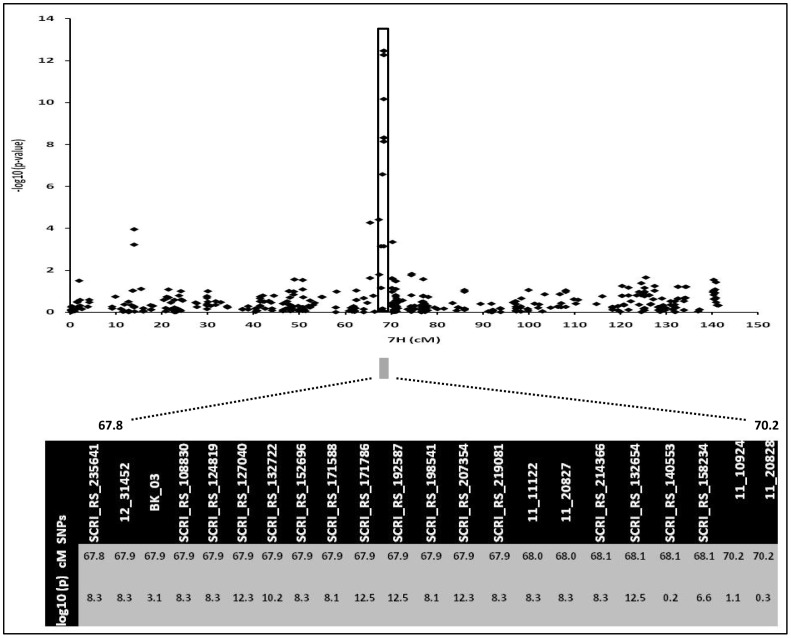
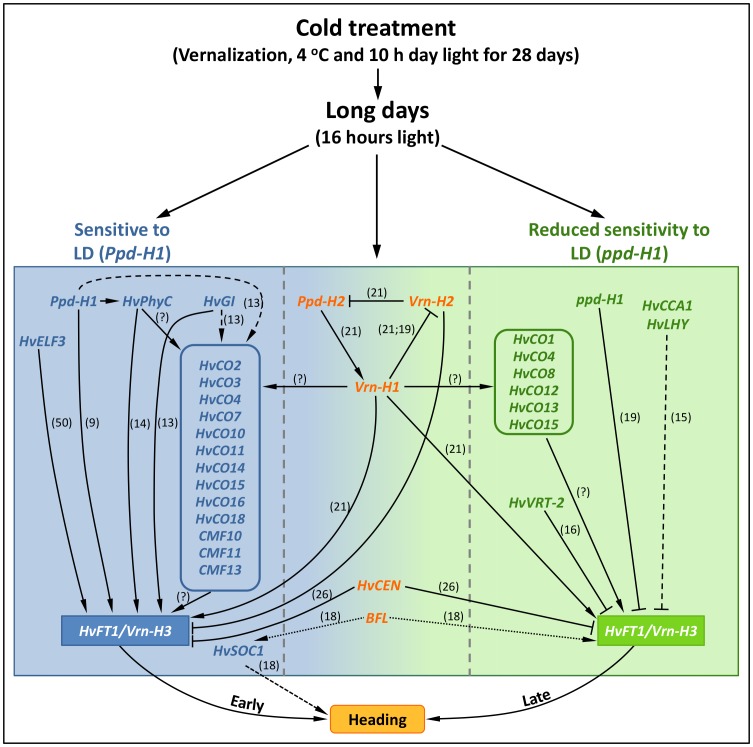
Heading time is a complex trait, and natural variation in photoperiod responses is a major factor controlling time to heading, adaptation and grain yield. In barley, previous heading time studies have been mainly conducted under field conditions to measure total days to heading. We followed a novel approach and studied the natural variation of time to heading in a world-wide spring barley collection (218 accessions), comprising of 95 photoperiod-sensitive (Ppd-H1) and 123 accessions with reduced photoperiod sensitivity (ppd-H1) to long-day (LD) through dissecting pre-anthesis development into four major stages and sub-phases. The study was conducted under greenhouse (GH) conditions (LD; 16/8 h; ∼20/∼16°C day/night). Genotyping was performed using a genome-wide high density 9K single nucleotide polymorphisms (SNPs) chip which assayed 7842 SNPs. We used the barley physical map to identify candidate genes underlying genome-wide association scans (GWAS). GWAS for pre-anthesis stages/sub-phases in each photoperiod group provided great power for partitioning genetic effects on floral initiation and heading time. In addition to major genes known to regulate heading time under field conditions, several novel QTL with medium to high effects, including new QTL having major effects on developmental stages/sub-phases were found to be associated in this study. For example, highly associated SNPs tagged the physical regions around HvCO1 (barley CONSTANS1) and BFL (BARLEY FLORICAULA/LEAFY) genes. Based upon our GWAS analysis, we propose a new genetic network model for each photoperiod group, which includes several newly identified genes, such as several HvCO-like genes, belonging to different heading time pathways in barley.


Conflict of interest statement

Competing Interests: The author has the following affiliation to commercial entities: Bayer CropScience NV; BK has declared that no other competing interests exist. BK has joined Bayer CropScience NV since April 2014. During experiment conducting, data collection and writing the manuscript he was working at IPK. This does not alter the authors' adherence to PLOS ONE policies on sharing data and materials.

Figures

Figure 1
Figure 1. Population structure of 218 spring barley accessions based on 6355 SNPs information.
95 accessions showing photoperiod response (Ppd-H1) and 123 accessions with reduced photoperiod sensitivity (ppd-H1).
Figure 2
Figure 2. General figure of barley pre-anthesis phases.
The figure includes the beginning developmental point from sowing to each stage (e.g. time to tipping is 1200 GDD; i.e. from sowing time to tipping stage) and the differences between stages (phase; e.g. tipping to heading phase (150 GDD); i.e. GDD for heading stage (1350 GDD) minus tipping stage (1200 GDD)). GDD is the average GDD in the whole collection (i.e. including both photoperiod groups). This figure also describes the developmental stages and sub-phases which form the late reproductive phase as described in (Alqudah and Schnurbusch 2014).
Figure 3
Figure 3. Thermal time for different developmental stages and sub-phases.
Thermal time from sowing to the beginning of awn primordium (AP), tipping (TIP), heading (HD) and anther extrusion (AE) stages and thermal time of the duration of sub-phases. Letters differentiate between photoperiod-sensitive (Ppd-H1) and reduced photoperiod sensitivity (ppd-H1). The same letters are not significantly different at P≤0.05. Bars indicate standard deviation (n = 95 and 123 for Ppd-H1 and ppd-H1 barleys, respectively).
Figure 4
Figure 4. Thermal time for different developmental stages and sub-phases.
Thermal time from sowing to the beginning of awn primordium (AP), tipping (TIP), heading (HD) and anther extrusion (AE) stages and thermal time of the duration of sub-phases. Letters differentiate between origins within photoperiod-sensitive (Ppd-H1) and reduced photoperiod sensitivity (ppd-H1). The same letters are not significantly different at P≤0.05. Bars indicate standard deviation. A). Number of Ppd-H1-carrying accessions for WANA  = 33, EU  = 16, EA  = 28 and AM  = 18. B). Number of accessions with reduced photoperiod sensitivity (ppd-H1) for WANA  = 12, EU  = 92, EA  = 8 and AM  = 11.
Figure 5
Figure 5. Number of QTLs (within confidence interval ±5 cM) overlapping between developmental stages in groups carrying A) photoperiod-sensitive (Ppd-H1) and B) reduced photoperiod sensitivity (ppd-H1).
Number in red denotes the number of shared QTLs between each pair of developmental stages. Number in yellow denotes the number of shared QTLs between all developmental stages. QTLs exceeding significance level (-log10 (P-value  = 0.01)) are considered as significantly associated.
Figure 6
Figure 6. Genetically anchored position of highly associated QTLs at all barley developmental stages and sub-phases in the photoperiod-sensitive (Ppd-H1) group using 9K SNP markers.
Bold and italicized gene names indicate genetically anchored positions of known heading time genes in the Barke x Morex RILs. Associated chromosomal regions are highlighted with different colors according to stages and sub-phases. Red chromosomal areas indicate the range of significantly associated QTLs (within confidence interval ±5 cM) which are exceeding FDR level of each developmental stage or sub-phase. Highlighted chromosomal regions in light blue denote group-specific associations.
Figure 7
Figure 7. Genetically anchored position of highly associated QTLs at all barley developmental stages and sub-phases in the group carrying reduced photoperiod sensitivity (ppd-H1) using 9K SNP markers.
Bold and italicized gene names indicate genetically anchored positions of known heading time genes in the Barke x Morex RILs. Associated chromosomal regions are highlighted with different colors according to the stages and sub-phases. Red chromosomal areas indicate the range of significantly associated QTLs (within confidence interval ±5 cM) which are exceeding FDR level of each developmental stage or sub-phase. Highlighted chromosomal regions in light green denote group-specific associations.
Figure 8
Figure 8. Regions of chromosome 7H showing association signals of the candidate gene (HvCO1) at the heading stage.
The top of the panel shows the region of the SNP marker peak (-log10 (p-value)). The lower panel zooms into a narrow region for the candidate region with the position and -log10 (p-value) of highly associated markers which are co-located with HvCO1 (67.9 cM).
Figure 9
Figure 9. Model of heading-time regulation in both photoperiod groups (Ppd-H1; ppd-H1) under long day (LD) condition.
Arrow heads indicate promotion of heading; whereas flat arrow heads indicate delay of heading. Genes with known roles in the regulation of heading time in barley are shown by continuous lines. Known interaction from Arabidopsis is shown in dashed lines. Known interaction from rice is shown in round dotted lines. Ambiguous interaction is indicated by a question mark. Numbers in parenthesis show the reference to published interaction.

Similar articles

Cited by

References

    1. Andres F, Coupland G (2012) The genetic basis of flowering responses to seasonal cues. Nature Reviews Genetics 13:627–639. - PubMed
    1. Purugganan MD, Fuller DQ (2009) The nature of selection during plant domestication. Nature 457:843–848. - PubMed
    1. Alqudah AM, Schnurbusch T (2014) Awn primordium to tipping is the most decisive developmental phase for spikelet survival in barley. Functional Plant Biology 41:424–436. - PubMed
    1. Sreenivasulu N, Schnurbusch T (2012) A genetic playground for enhancing grain number in cereals. Trends in Plant Science 17:91–101. - PubMed
    1. Borràs G, Romagosa I, van Eeuwijk F, Slafer GA (2009) Genetic variability in duration of pre-heading phases and relationships with leaf appearance and tillering dynamics in a barley population. Field Crops Research 113:95–104.

Publication types

MeSH terms