. 2015 Feb;20(1):140-7.
doi: 10.1038/mp.2014.145. Epub 2014 Nov 25.

The 16p11.2 locus modulates brain structures common to autism, schizophrenia and obesity

Collaborators, Affiliations
Free PMC article

The 16p11.2 locus modulates brain structures common to autism, schizophrenia and obesity

A M Maillard et al. Mol Psychiatry. 2015 Feb.
Free PMC article

Abstract

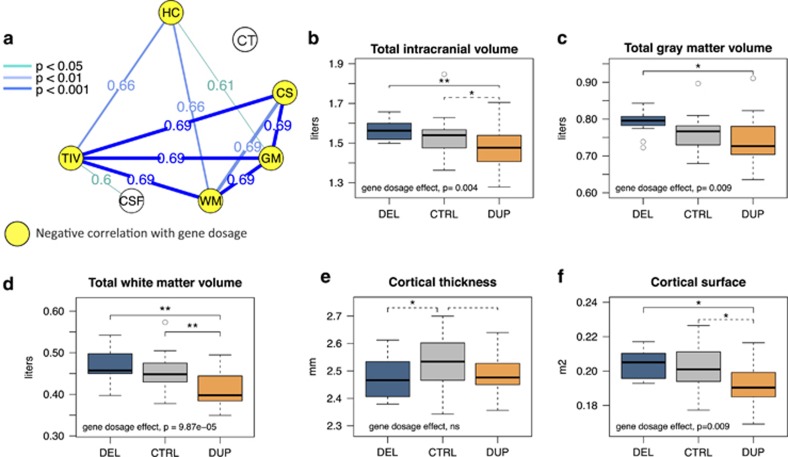
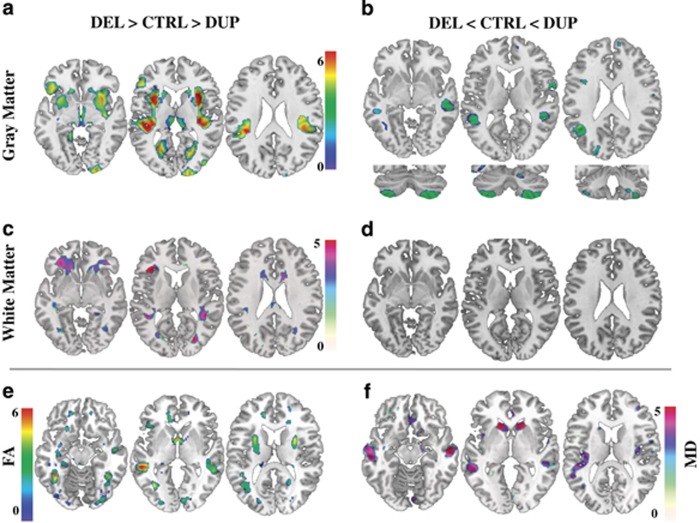
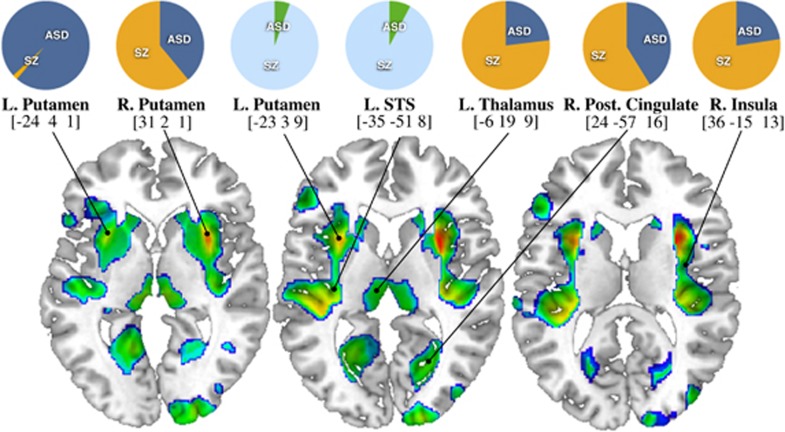
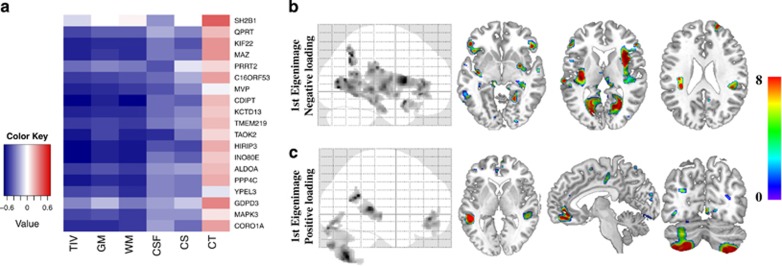
Anatomical structures and mechanisms linking genes to neuropsychiatric disorders are not deciphered. Reciprocal copy number variants at the 16p11.2 BP4-BP5 locus offer a unique opportunity to study the intermediate phenotypes in carriers at high risk for autism spectrum disorder (ASD) or schizophrenia (SZ). We investigated the variation in brain anatomy in 16p11.2 deletion and duplication carriers. Beyond gene dosage effects on global brain metrics, we show that the number of genomic copies negatively correlated to the gray matter volume and white matter tissue properties in cortico-subcortical regions implicated in reward, language and social cognition. Despite the near absence of ASD or SZ diagnoses in our 16p11.2 cohort, the pattern of brain anatomy changes in carriers spatially overlaps with the well-established structural abnormalities in ASD and SZ. Using measures of peripheral mRNA levels, we confirm our genomic copy number findings. This combined molecular, neuroimaging and clinical approach, applied to larger datasets, will help interpret the relative contributions of genes to neuropsychiatric conditions by measuring their effect on local brain anatomy.


Figures

Figure 1
Figure 1
Effects of gene dosage on global brain metrics. (a): Correlation between global brain metrics in 16p11.2 CNV carriers and controls. The intensity of blue lines represents positive r Pearson's coefficient correlations at different statistical thresholds. All global measures are inter-correlated except for CT and CSF. (bf): Boxplots representing TIV, GM, WM volume, cortical surface area and cortical thickness adjusted for age and gender in deletion, duplication carriers and intrafamilial controls. **P⩽0.001; *P⩽0.05 uncorrected. Gene dosage effect is estimated in a linear regression analysis using the number of copies (1, 2 or 3), and including age, gender as covariates. Significant differences between groups after Bonferroni correction (threshold at P<0.01) are represented by solid black lines, trends—by dashed lines. HC, head circumference; TIV, total intracranial volume; GM, gray matter; WM, white matter; CSF, cerebrospinal fluid; CT, cortical thickness; CS, cortical surface area; DEL, deletion carriers; CTRL, intrafamilial controls; DUP, duplication carriers.
Figure 2
Figure 2
Effects of gene dosage on local brain volume and tissue properties. Results of voxel-based whole-brain general linear analyses showing: (a) negative gene dosage effect (DEL>CTRL>DUP) on GM volume in ventral striatum, thalamus, superior temporal region, fusiform, precuneus, insula and calcarine sulci bilaterally as well as in right occipital region. (b) Positive gene dosage effect (DEL<CTRL<DUP) on GM volume in the middle temporal gyrus and in cerebellar lobule VIII, VIIb and crus II. (c) Negative gene dosage effect on WM volume within fronto-striatal projections, anterior thalamic and superior longitudinal fasciculus. (d) Absence of significant positive gene dosage effect on WM volume. (e and f) FA and MD changes overlapping with GM changes in superior temporal gyrus and caudate bilaterally. For representation purposes, results significant at a voxel level at threshold of P<0.05 family-wise error corrected for multiple comparisons are displayed at significance threshold of P<0.001 uncorrected at voxel level in standard Montreal Neurological Institute space. Color bars represent T scores. DEL, deletion carriers; CTRL, intrafamilial controls; DUP, duplication carriers; GM, gray matter; WM, white matter; FA, fractional anisotropy; MD, mean diffusivity.
Figure 3
Figure 3
Spatial mapping of meta-analysis data in autism spectrum disorder and schizophrenia on to 16p11.2 gene dosage brain pattern. Projection of meta-analysis data in ASD and SZ on the statistical map of 16p11.2 gene dosage effects on gray matter volume in deletion and duplication carriers (DEL>CTRL>DUP). Pie charts represent previously published data on the relative contribution of ASD and SZ to brain volume change at particular location. Orange-blue pie charts indicate gray matter decreases; cyan-green pie charts show gray matter increases in ASD and SZ. Coordinates correspond to Montreal Neurological Institute standard space. ASD, autism spectrum disorder; SZ, schizophrenia; STS, superior temporal sulcus.
Figure 4
Figure 4
Effects of mRNA levels on global and local metrics of brain anatomy. Brain anatomy changes explained by mRNA levels of 18 genes within the 16p11.2 BP4-BP5 interval in a subset of 27 participants. (a) Matrix correlation between mRNA levels and global measures of brain volume. The color key represents the Pearson correlation coefficient. Most mRNA levels, except for SH2B1, PRRT2 and GDPD3 are correlated to TIV, GM and WM. There are no correlations with cortical thickness and CSF. Statistical P values for all correlations are detailed in Supplementary Table 7. (b-c) Eigenimages represent the statistical parametric maps resulting from singular value decomposition analysis. This method simultaneously determines the best combination in each dataset (gene expression and voxels) in order to explain maximum covariance between gene expression and local brain volume. Negative loading indicate that low mRNA levels are associated with increased GM volumes while positive loading represents the inverse effect. TIV, total intracranial volume; GM, gray matter; WM, white matter; CSF, cerebrospinal fluid; CS, cortical surface area; CT, cortical thickness.

References

    1. Malhotra D, Sebat J. CNVs: harbingers of a rare variant revolution in psychiatric genetics. Cell. 2012;148:1223–1241. - PMC - PubMed
    1. Gottesman II, Gould TD. The endophenotype concept in psychiatry: etymology and strategic intentions. Am J Psychiatry. 2003;160:636–645. - PubMed
    1. Bochukova EG, Huang N, Keogh J, Henning E, Purmann C, Blaszczyk K, et al. Large, rare chromosomal deletions associated with severe early-onset obesity. Nature. 2010;463:666–670. - PMC - PubMed
    1. Hanson E, Bernier R, Porche K, Jackson FI, Goin-Kochel RP, Snyder LG, et al. The Cognitive and behavioral phenotype of the 16p11.2 deletion in a clinically ascertained population Biol Psychiatry(in press) - PMC - PubMed
    1. Jacquemont S, Reymond A, Zufferey F, Harewood L, Walters RG, Kutalik Z, et al. Mirror extreme BMI phenotypes associated with gene dosage at the chromosome 16p11.2 locus. Nature. 2011;478:97–102. - PMC - PubMed

Publication types

MeSH terms

Substances