. 2014 Nov;38(11):2835-43.
doi: 10.1111/acer.12547.

Chronic alcohol self-administration in monkeys shows long-term quantity/frequency categorical stability

Affiliations

Chronic alcohol self-administration in monkeys shows long-term quantity/frequency categorical stability

Erich J Baker et al. Alcohol Clin Exp Res. 2014 Nov.

Abstract

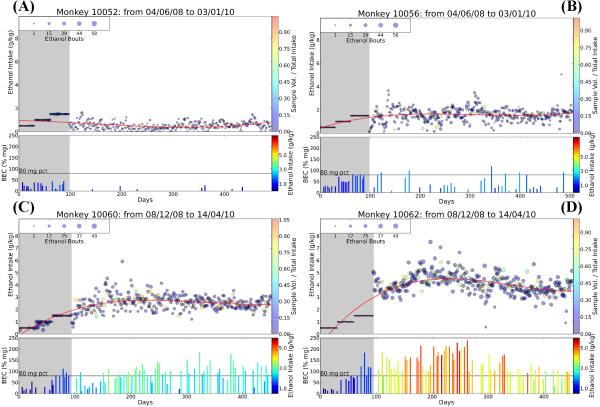
Background: The current criteria for alcohol use disorders (AUDs) do not include consumption (quantity/frequency) measures of alcohol intake, in part due to the difficulty of these measures in humans. Animal models of ethanol (EtOH) self-administration have been fundamental in advancing our understanding of the neurobiological basis of AUD and can address quantity/frequency measures with accurate measurements over prolonged periods of time. The nonhuman primate model of voluntary oral alcohol self-administration has documented both binge drinking and drinking to dependence and can be used to test the stability of consumption measures over time.

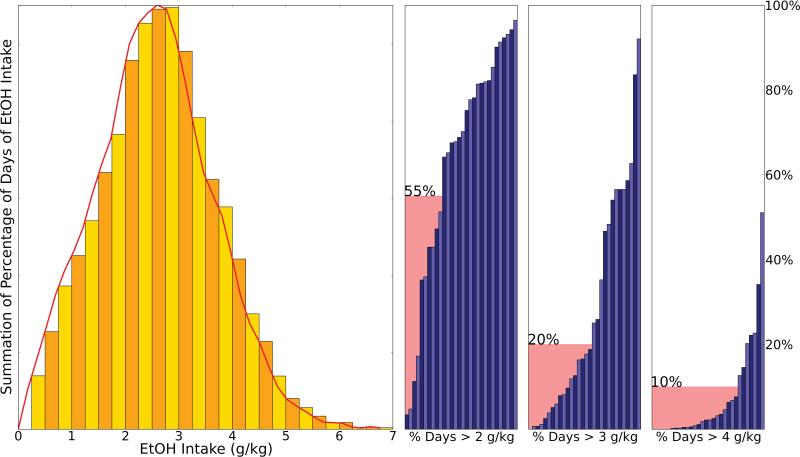
Methods: Here, an extensive set of alcohol intakes (g/kg/d) was analyzed from a large multi-cohort population of Rhesus (Macaca mulatta) monkeys (n = 31). Daily EtOH intake was uniformly distributed over chronic (12 months) access for all animals.

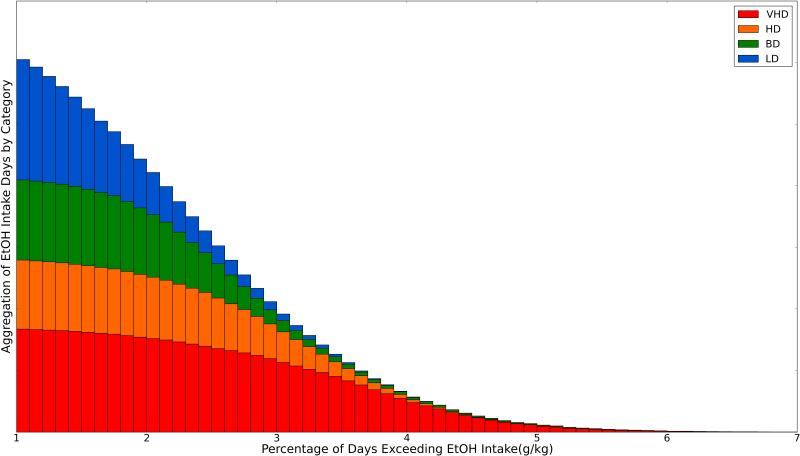
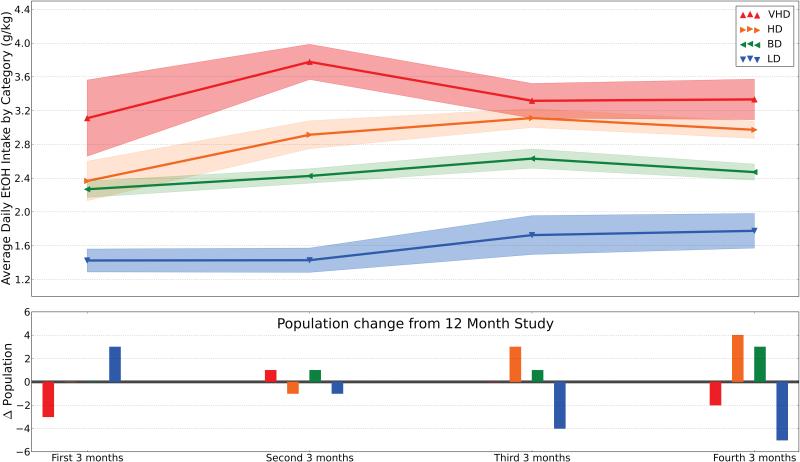
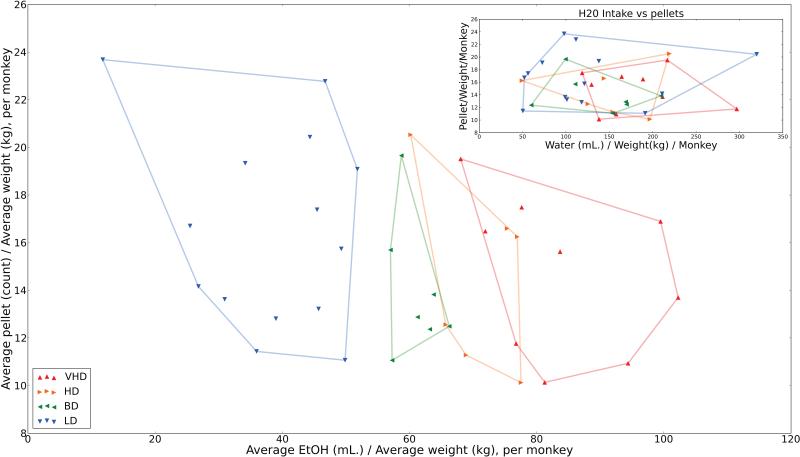
Results: Underlying this distribution of intakes were subpopulations of monkeys that exhibited distinctive clustering of drinking patterns, allowing us to categorically define very heavy drinking (VHD), heavy drinking (HD), binge drinking (BD), and low drinking (LD). These categories were stable across the 12 months assessed by the protocol, but exhibited fluctuations when examined at shorter intervals.

Conclusions: The establishment of persistent drinking categories based on quantity/frequency suggests that consumption variables can be used to track long-term changes in behavioral, molecular, or physiochemical mechanisms related to our understanding of diagnosis, prevention, intervention, and treatment efficacies.

Keywords: Alcohol; Binge Drinking; EtOH; Nonhuman Primates; Self-Administration.


Figures

Figure 1
Figure 1
Distribution of daily ethanol intake during open access. Panel (A) represents the aggregate summation for all animals (31 drinking animals representing male Rhesus cohorts 4, 5, 7a, 7b) in the “open-access” (22 hr/day access) condition (min 341 – max 405 days). Ethanol intake (g/kg/day) is plotted along the x-axis, ranging from 0-7 g/kg/day. The distribution (mean=2.388, stdev=1.09) meets qualitative tests for bounded uniform distribution. For all monkeys, the number of days that exceed 2 g/kg is 63.7% (0. 26 stdev), the number of day that exceeded 3 g/kg is 27.6%, (0.58 stdev), and the number of days that exceeded 4 g/kg is 7.29% (1.48 stdev). Panel (B) illustrates the percentage of days where each animal exceeded 2 g/kg, 3 g/kg, and 4 g/kg (subpanels, left to right). Cutoff thresholds (2.0 g/kg, 3.0 g/kg and 4.0 g/kg) for BD, HD, and VHD were set to 55%, 20%, and 10%, respectively, based on previous publications for BD (Monti et al, 2004), HD and VHD (Grant et al., 2008, Grant et al., 2014).
Figure 2
Figure 2
Distribution of EtOH intake over animals classified as LD, BD, HD, and VHD. This graph illustrates the aggregate summation for all animals, grouped by classification, and stacked ranging from 0-7 g/kg. The classification demonstrates group-dependent regularity within intake ranges as dose increase, with VHD drinkers, for example, representing the largest subset of animals consuming greater than 4 g/kg.
Figure 3
Figure 3
Representative categorical drinking patterns illustrate numerous differences between (A) LD, (B) BD, (C) HD, and (D) VHD individual animals. Each panel spans induction and open access timeframes. In the top graph of each panel is the daily ethanol intake over induction (shaded in gray) and during the open-access 22 hr session (no shading). The size of the circles in the upper graphs of each panel represents the number of bouts taken during the session and the color of the circles represents the sample volume as a percentage of the total intake. The lower graphs of each panel represents the BECs during induction (gray shading) and the 22 hr session (no shading). Ethanol intake at the time of the sample is depicted by color (left axis). A typical LD animal has small ethanol bout sizes, stable and low levels of alcohol consumption, and seldom reach 80 mg/% BEC levels indicative of intoxication. BD animals have relatively low alcohol consumption but, unlike LD animals, experience periodic bouts of ethanol consumption, elevated BEC levels, and days of abstinence. While VHD and HD animals exceed 80 mg/% BEC levels on numerous occasions, VHD animals consistently exceed this value with a lower percentage of daily ethanol intake at time of BEC measure.
Figure 4
Figure 4
Stability of categorical drinking classifications over time. This figure illustrates the categorical classifications of animals examined in 3-month epochs within the 12-month open access protocol. (Top) Average ethanol consumption (lines) and standard error (shaded areas) for each category is plotted across smaller time frames. Categories defined by 12-month drinking history are very stable, with each category expressing the appropriate order and delineation during each time period. However, if categories were assigned using the original assignment criteria based on only 3 months of data, there is some localized variability when compared to the 12-month assignment (Bottom). For example, the first 3 months indicates an additional 3 low drinking animals and a loss of 3 VHD. Conversely, the final 3-month period indicates a loss of 5 LD and 2 VHD and the consequent gain of 4 HD and 3 BD.
Figure 5
Figure 5
Categorical drinking assignment in ethanol and water consumption. This figure illustrates the correlation of ethanol consumption (g/kg) normalized for weight with the number of food pellets consumed for each animal normalized for weight. It is interesting to note an almost complete partitioning of drinking categories based on ethanol consumption. This same distribution is not viewed in the case of normalized food intake versus water consumption.

References

    1. Asquith M, Pasala S, Engelmann F, Haberthus K, Meyer C, Park B. Chronic ethanol consumption modulates growth factor release, mucosal cytokine production and microRNA expression in nonhuman primates. Alc. Clin. Exper. Res. In Press. - PMC - PubMed
    1. Chang ET, Clarke CA, Canchola AJ, Lu Y, Wang SS, Ursin G, West DW, Bernstein L, Horn-Ross PL. Alcohol consumption over time and risk of lymphoid malignancies in the California Teachers Study cohort. Am. J. Epidemiol. 2010;172:1373–1383. - PMC - PubMed
    1. Cheng H-J, Grant KA, Han Q-H, Daunais JB, Friedman DP, Masutani S, Little WC, Cheng C-P. Up-regulation and functional effect of cardiac β 3-adrenoreceptors in alcoholic monkeys. Alcohol. Clin. Exp. Res. 2010;34:1171–1181. - PMC - PubMed
    1. Crabbe JC, Harkness JH, Spence SE, Huang LC, Metten P. Intermittent availability of ethanol does not always lead to elevated drinking in mice. Alcohol Alcohol. Oxf. Oxfs. 2012;47:509–517. - PMC - PubMed
    1. Cuzon Carlson VC, Seabold GK, Helms CM, Garg N, Odagiri M, Rau AR, Daunais J, Alvarez VA, Lovinger DM, Grant KA. Synaptic and morphological neuroadaptations in the putamen associated with long-term, relapsing alcohol drinking in primates. Neuropsychopharmacol. Off. Publ. Am. Coll. Neuropsychopharmacol. 2011;36:2513–2528. - PMC - PubMed

Publication types