. 2015 Feb;35(3):555-65.
doi: 10.1128/MCB.01208-14. Epub 2014 Nov 24.

NCoR1 and SMRT play unique roles in thyroid hormone action in vivo

Affiliations

NCoR1 and SMRT play unique roles in thyroid hormone action in vivo

Hiroaki Shimizu et al. Mol Cell Biol. 2015 Feb.

Abstract

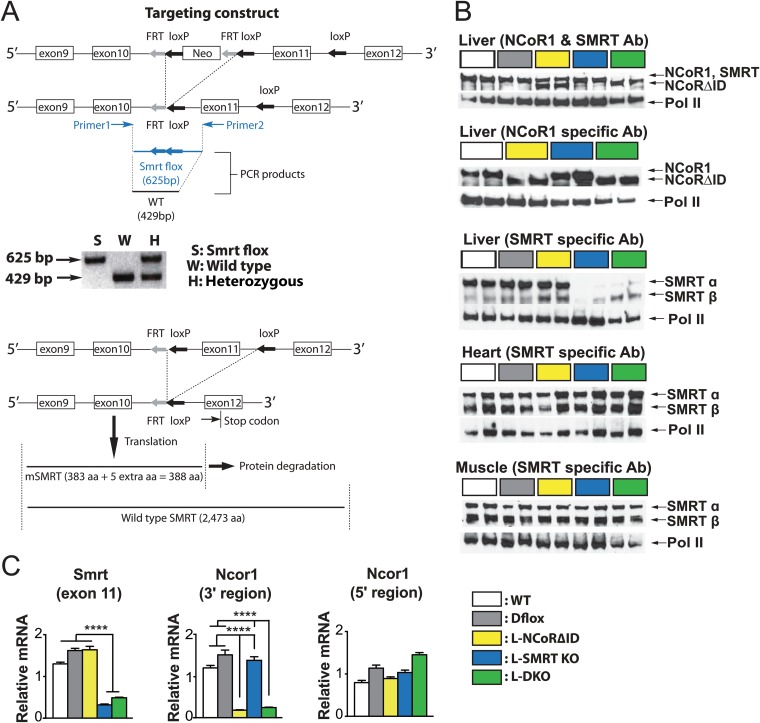
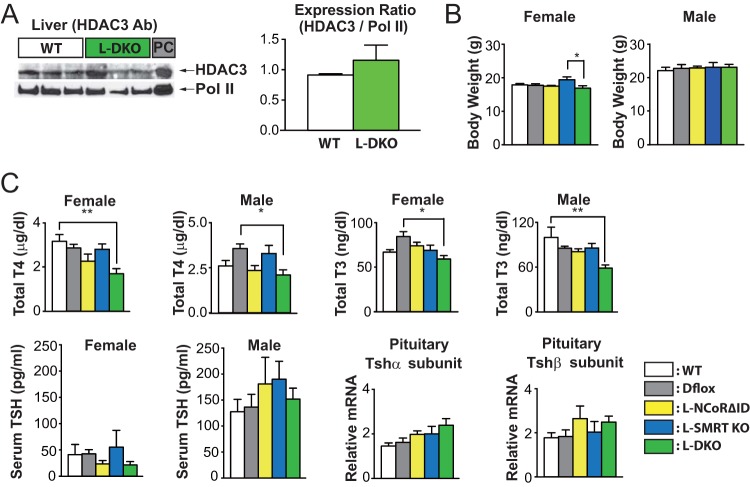
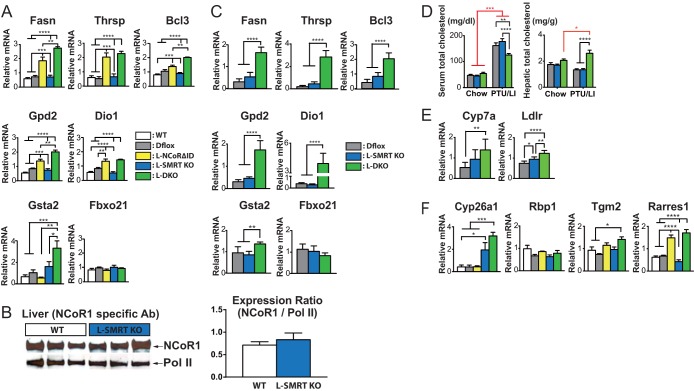
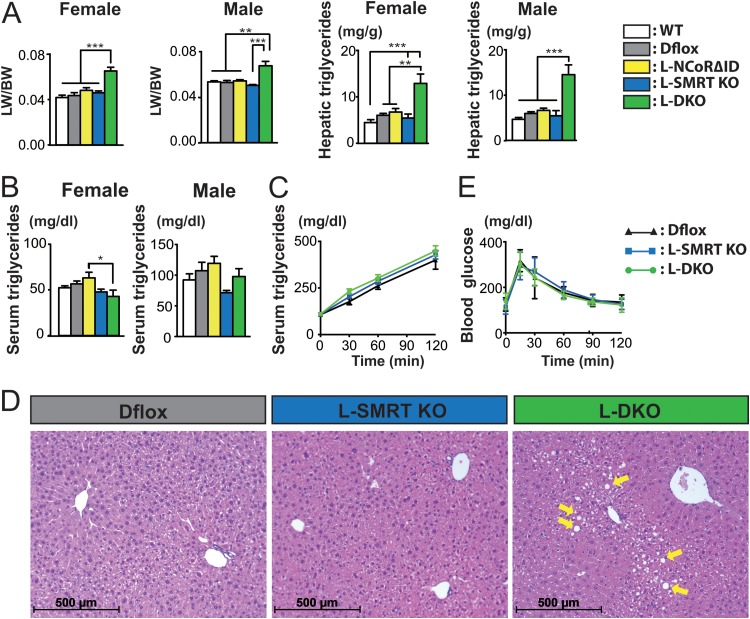
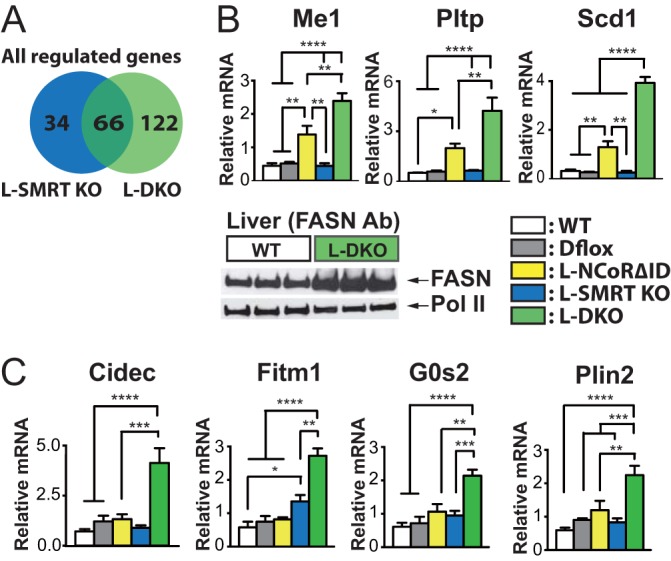
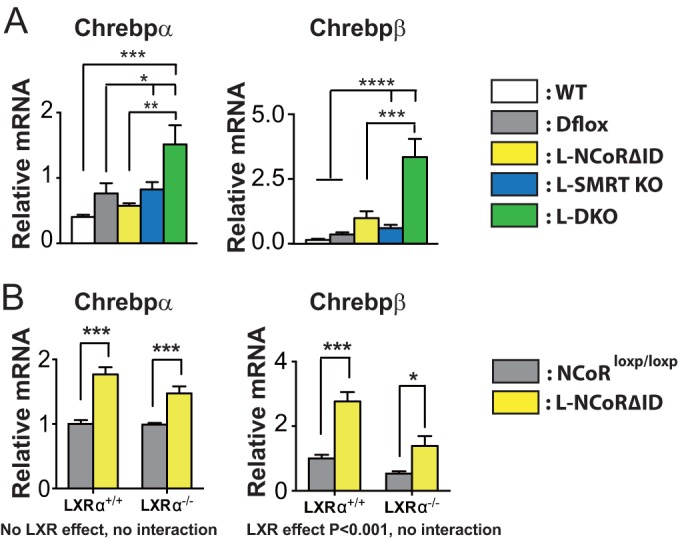
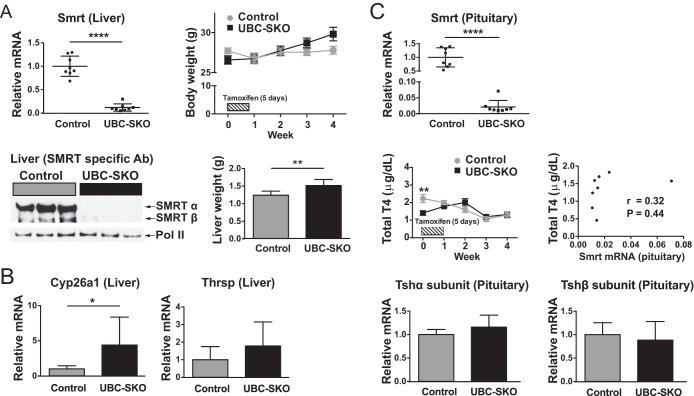
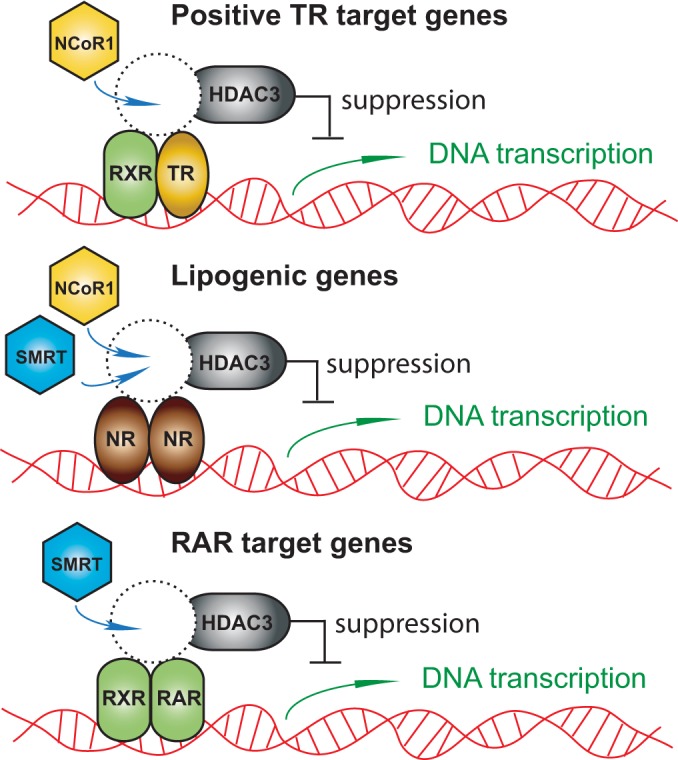
NCoR1 (nuclear receptor corepressor) and SMRT (silencing mediator of retinoid and thyroid hormone receptors; NCoR2) are well-recognized coregulators of nuclear receptor (NR) action. However, their unique roles in the regulation of thyroid hormone (TH) signaling in specific cell types have not been determined. To accomplish this we generated mice that lacked function of either NCoR1, SMRT, or both in the liver only and additionally a global SMRT knockout model. Despite both corepressors being present in the liver, deletion of SMRT in either euthyroid or hypothyroid animals had little effect on TH signaling. In contrast, disruption of NCoR1 action confirmed that NCoR1 is the principal mediator of TH sensitivity in vivo. Similarly, global disruption of SMRT, unlike the global disruption of NCoR1, did not affect TH levels. While SMRT played little role in TH-regulated pathways, when disrupted in combination with NCoR1, it greatly accentuated the synthesis and storage of hepatic lipid. Taken together, these data demonstrate that corepressor specificity exists in vivo and that NCoR1 is the principal regulator of TH action. However, both corepressors collaborate to control hepatic lipid content, which likely reflects their cooperative activity in regulating the action of multiple NRs including the TH receptor (TR).


Figures

FIG 1
FIG 1
Disruption of NCoR1 and SMRT in the liver. (A) Conditional targeting of the mouse smrt gene. In the cartoon of the mouse smrt gene, the exons are shown by numbered boxes. loxP sites and the FRT-Neo-FRT cassette are indicated with arrows. Positions of the PCR primers and image of the PCR products are shown below the targeting construct map (upper map). The expected size of the PCR fragment encompassing the targeted SMRT locus (625 bp) is 196 bp larger than that of the wild-type locus (429 bp). After albumin-Cre recombinase expression in the liver, exon 11 is deleted, and a stop codon has appeared in exon 12, truncating the SMRT allele (lower map). aa, amino acids. (B) Western analysis was performed using an antibody (Ab) directed against both NCoR1 and SMRT or each in the indicated genotypes and the indicated tissues. Pol II, polymerase II. (C) qPCR was performed on mRNA using assays directed against the 5′ or 3′ region of NCoR1 and exon 11 of SMRT. ****, P < 0.0001.
FIG 2
FIG 2
Liver-specific disruption of nuclear corepressor function does not alter development. (A) Western analysis was performed using an antibody against HDAC3. PC, positive control of HDAC3 expressed in lysate from 293T cells. Band intensity was quantified by ImageJ software and normalized for Pol II. These data are shown as the means ± standard errors of the means (SEM). (B) Body weights of both male and female mice (7 to 9 weeks of age) were measured in all genotypes. (C) Total T4, total T3, and plasma TSH levels were determined in the indicated genotypes, and qPCR for the TSH subunit genes was also performed in female mice. For qPCR and thyroid function studies, 5 or 6 mice per group were used. The data are shown as the means ± SEM. **, P < 0.01; *, P < 0.05 (by one-way ANOVA).
FIG 3
FIG 3
Thyroid hormone action is regulated by NCoR1 and not SMRT. (A) qPCR was performed on hepatic mRNA from all genotypes in the euthyroid state. (B) Western analysis of hepatic protein extracts from the indicated genotypes was performed using an antibody directed against NCoR1. The intensity of each protein band was quantified by ImageJ software, and expression was normalized for Pol II. The data are shown as the means ± SEM. (C) A second cohort of mice was rendered hypothyroid by a PTU/LI diet for 3 weeks. qPCR was performed on hepatic mRNA. (D) Serum and hepatic cholesterol concentrations were compared between chow-fed and PTU/LI diet-fed mice in three genotype groups (n = 5 or 6 mice per group). For serum and hepatic total cholesterols, the data are shown as the means ± SEM. ****, P < 0.0001; ***, P < 0.001; **, P < 0.01; *, P < 0.05 (by two-way ANOVA). (E) Hepatic qPCR analysis of cholesterol metabolism-related-genes compared across three genotype groups in the hypothyroid state (n = 5 or 6 mice per group). For qPCR, the data are shown as the means ± SEM. ****, P < 0.0001; **, P < 0.01; *, P < 0.05 (by one-way ANOVA). (F) qPCR was performed on RAR target genes from all genotypes in the euthyroid state. For qPCR, 5 or 6 mice per group were used. The data are shown as the means ± SEM. ****, P < 0.0001; ***, P < 0.001; **, P < 0.01; *, P < 0.05 (by one-way ANOVA).
FIG 4
FIG 4
Disruption of NCoR1 and SMRT causes hepatic steatosis. (A) Liver weight normalized for body weight (LW/BW) and hepatic triglyceride levels were determined in all genotypes from both male and female animals (n = 5 or 6 per group). (B) Serum triglyceride levels were determined in both male and female mice across all genotypes (n = 5 or 6 per group). (C) VLDL secretion was determined by measuring serum triglycerides both before and after the injection of tyloxapol in female animals (n = 4 to 8 per group). (D) Representative H&E staining of liver sections with lipid droplet accumulation (arrows) within the indicated genotypes. (E) Glucose tolerance tests were performed on female mice with the indicated genotypes (n = 7 to 15 per group). For panels A, B, C, and E the data are shown as the means ± SEM. ***, P < 0.001; **, P < 0.01; *, P < 0.05 (by one-way ANOVA).
FIG 5
FIG 5
NCoR1 and SMRT regulate lipogenesis and lipid storage. (A) Microarray analysis was performed on mRNA from Dflox, L-SMRT KO, and L-DKO mice. Shown are the genes regulated by greater than 2-fold in L-SMRT KO and L-DKO versus Dflox controls. (B) Lipogenic gene expression was analyzed by qPCR in all genotypes, and Western analysis was used to assess FASN protein levels. (C) The expression of lipid storage genes was determined by qPCR in all genotypes in female mice. For qPCR, 5 or 6 mice per group were used. The data are shown as the means ± SEM. ****, P < 0.0001; ***, P < 0.001; **, P < 0.01; *, P < 0.05 (by one-way ANOVA).
FIG 6
FIG 6
ChREBP expression is activated by the disruption of NCoR1 and SMRT. (A) The expression levels of ChREBPα and ChREBPβ were determined by qPCR in hepatic mRNA from female mice across all genotypes (n = 5 or 6 mice per group). The data are shown as the means ± standard errors of the means. ****, P < 0.0001; ***, P < 0.001; **, P < 0.01; *, P < 0.05 (by one-way ANOVA). (B) The expression levels of ChREBPα and ChREBPβ were determined by qPCR in hepatic mRNA from female L-NCoRΔID mice that either expressed LXRα or were null for LXRα. For this qPCR, 5 or 6 mice per group were used. The data are shown as the means ± SEM. ***, P < 0.001; *, P < 0.05 (by two-way ANOVA).
FIG 7
FIG 7
Global deletion of SMRT does not effect the hypothalamic-pituitary-thyroid axis. (A) SMRT mRNA and protein levels were analyzed to assess the recombination efficiency in the liver of UBC-SKO and control mice 4 weeks after tamoxifen treatment. The qPCR assay used is against exon 11 of SMRT. Body weights were measured in control and UBC-SKO mice at the indicated time points. Livers were weighed at the end of the experiment. (B) The expression levels of cyp26a1 and thrsp were determined by qPCR in hepatic mRNA from the indicated groups. (C) Gene expression of smrt, tshα, and tshβ subunits in the pituitary were quantified by qPCR from both UBC-SKO and control mice. Serum total T4 levels were measured in control and UBC-SKO mice at the indicated time points after administration of tamoxifen. All data are shown as the means ± SEM (****, P < 0.0001; **, P < 0.01; *, P < 0.05). An unpaired t test was used for all data except for total T4 levels and body weights, which were compared statistically by two-way repeated-measures ANOVA (n = 8 male mice per group).
FIG 8
FIG 8
A model for hepatic corepressor function. NCoR1 is the principal corepressor that regulates thyroid hormone action in the liver through the recruitment of HDAC3. In contrast, with respect to lipogenic genes and those involved in lipid storage, both NCoR1 and SMRT play a role either through their involvement with separate NRs or through the regulation of ChREBP. Finally, SMRT may be the principal corepressor for RAR isoform signaling.

Similar articles

Cited by

References

    1. Bianco AC, Kim BW. 2006. Deiodinases: implications of the local control of thyroid hormone action. J Clin Invest 116:2571–2579. doi:10.1172/JCI29812. - DOI - PMC - PubMed
    1. Yen PM. 2001. Physiological and molecular basis of thyroid hormone action. Physiol Rev 81:1097–1142. - PubMed
    1. Cheng SY, Leonard JL, Davis PJ. 2010. Molecular aspects of thyroid hormone actions. Endocr Rev 31:139–170. doi:10.1210/er.2009-0007. - DOI - PMC - PubMed
    1. Astapova I, Hollenberg AN. 2013. The in vivo role of nuclear receptor corepressors in thyroid hormone action. Biochim Biophys Acta 1830:3876–3881. doi:10.1016/j.bbagen.2012.07.001. - DOI - PMC - PubMed
    1. Astapova I, Lee LJ, Morales C, Tauber S, Bilban M, Hollenberg AN. 2008. The nuclear corepressor, NCoR, regulates thyroid hormone action in vivo. Proc Natl Acad Sci U S A 105:19544–19549. doi:10.1073/pnas.0804604105. - DOI - PMC - PubMed

Publication types

MeSH terms