Comparative Study
. 2015 Jan;36(1):122-32.
doi: 10.1093/carcin/bgu237. Epub 2014 Nov 23.

Comparison of tamoxifen and letrozole response in mammary preneoplasia of ER and aromatase overexpressing mice defines an immune-associated gene signature linked to tamoxifen resistance

Affiliations
Comparative Study

Comparison of tamoxifen and letrozole response in mammary preneoplasia of ER and aromatase overexpressing mice defines an immune-associated gene signature linked to tamoxifen resistance

Sarah A Dabydeen et al. Carcinogenesis. 2015 Jan.

Abstract

Response to breast cancer chemoprevention can depend upon host genetic makeup and initiating events leading up to preneoplasia. Increased expression of aromatase and estrogen receptor (ER) is found in conjunction with breast cancer. To investigate response or resistance to endocrine therapy, mice with targeted overexpression of Esr1 or CYP19A1 to mammary epithelial cells were employed, representing two direct pathophysiological interventions in estrogen pathway signaling. Both Esr1 and CYP19A1 overexpressing mice responded to letrozole with reduced hyperplastic alveolar nodule prevalence and decreased mammary epithelial cell proliferation. CYP19A1 overexpressing mice were tamoxifen sensitive but Esr1 overexpressing mice were tamoxifen resistant. Increased ER expression occurred with tamoxifen resistance but no consistent changes in progesterone receptor, pSTAT3, pSTAT5, cyclin D1 or cyclin E levels in association with response or resistance were found. RNA-sequencing (RNA-seq) was employed to seek a transcriptome predictive of tamoxifen resistance using these models and a second tamoxifen-resistant model, BRCA1 deficient/Trp53 haploinsufficient mice. Sixty-eight genes associated with immune system processing were upregulated in tamoxifen-resistant Esr1- and Brca1-deficient mice, whereas genes related to aromatic compound metabolic process were upregulated in tamoxifen-sensitive CYP19A1 mice. Interferon regulatory factor 7 was identified as a key transcription factor regulating these 68 immune processing genes. Two loci encoding novel transcripts with high homology to human immunoglobulin lambda-like polypeptide 1 were uniquely upregulated in the tamoxifen-resistant models. Letrozole proved to be a successful alternative to tamoxifen. Further study of transcriptional changes associated with tamoxifen resistance including immune-related genes could expand our mechanistic understanding and lead to biomarkers predictive of escape or response to endocrine therapies.


Figures

Fig. 1.
Fig. 1.
Comparison of changes in HAN prevalence and number, DH prevalence and proliferative and apoptotic indices in Esr1 and CYP19A1 overexpressing mice with tamoxifen and letrozole treatment. (A) Bar graphs comparing HAN prevalence in control untreated, letrozole-treated and tamoxifen-treated Esr1 and CYP19A1 overexpressing mice. Esr1 control: 67%, n = 7; letrozole: none detected, n = 7; tamoxifen: 56%, n = 9; CYP19A1 control: 60%, n = 10; letrozole: none detected, n = 6; tamoxifen: 14%, n = 11. *P < 0.05, Fisher’s exact. (B) Bar graphs comparing number of HANs/gland in control untreated, letrozole-treated and tamoxifen-treated Esr1 and CYP19A1 overexpressing mice. Esr1 control: 2.0±0.9, n = 7; letrozole: none detected, n = 7; tamoxifen: 0.8±0.3, n = 9; CYP19A1 control: 0.8±0.1, n = 10; letrozole: none detected, n = 6; tamoxifen: 0.1±0.1, n = 11. *P < 0.05, t-test, unpaired, one-tailed. Mean and standard error of the mean indicated. (C) Bar graphs comparing DH prevalence in control untreated, letrozole-treated and tamoxifen-treated Esr1 and CYP19A1 overexpressing mice. Esr1 control: 40%, n = 7; letrozole: none detected, n = 7; tamoxifen: 12%, n = 9; CYP19A1 control: 31%, n = 10; letrozole: none detected, n = 6; tamoxifen: 9%, n = 11. *P < 0.05, Fisher’s exact. (D) Bar graphs comparing proliferative indices in control untreated, letrozole-treated and tamoxifen-treated Esr1 and CYP19A1 overexpressing mice. Esr1 control: 10.1±4.5, n = 5; letrozole: 2.3±1.1, n = 5; tamoxifen: 6.4±1.5, n = 9; CYP19A1 control: 8.4±4.7, n = 6; letrozole: 1.4±0.6, n = 3; tamoxifen: 5.7±0.9, n = 7. *P < 0.05, Mann–Whitney, unpaired, one-tailed (E) Bar graphs comparing apoptotic indices in control untreated, letrozole-treated and tamoxifen-treated Esr1 and CYP19A1 overexpressing mice. Esr1 control: 0.5±0.5, n = 4; letrozole: 0.5±0.3, n = 4; tamoxifen: 0.8±0.4, n = 5; CYP19A1 control: none detectable, n = 3; letrozole: 1.8±1.1, n = 5; tamoxifen: 1.4±0.5, n = 5. (F) Representative images of mammary gland whole mounts from control untreated, letrozole-treated and tamoxifen-treated Esr1 and CYP19A1 overexpressing mice. Arrows indicate HANs. Size bar = 1mm. (G) Representative images of Ki67 IHC on sections of mammary gland tissue from control untreated, letrozole-treated and tamoxifen-treated Esr1 and CYP19A1 overexpressing mice. Arrows indicate representative mammary epithelial cells with nuclear-localized staining for Ki67. Images taken at ×40. Size bar = 20 µm. (H) Representative images of TUNEL assay on sections of mammary gland tissue from control, letrozole-treated and tamoxifen-treated Esr1 and CYP19A1 overexpressing mice. Arrows indicate representative TUNEL-labeled mammary epithelial cells. Images were taken at ×40. Size bar = 20 µm.
Fig. 2.
Fig. 2.
Comparison of changes in percentages of mammary epithelial cells demonstrating nuclear-localized expression of ER, PGR, cyclin D1, cyclin E, phosphorylated STAT3 and phosphorylated STAT5 in Esr1 and CYP19A1 overexpressing mice with tamoxifen and letrozole treatment. (A) Bar graphs and representative histological images of IHC comparing percentage of mammary epithelial cells demonstrating nuclear-localized ER expression from control untreated, letrozole-treated and tamoxifen-treated Esr1 and CYP19A1 overexpressing mice. Esr1 control: 6.8±1.3, n = 6; letrozole: 6.9±1.4, n = 7; tamoxifen: 15.0±3.4, n = 8; CYP19A1 control: 16.0±3.2, n = 7; letrozole: 5.0±2.3, n = 5; tamoxifen: 11.0±1.5, n = 4. (B) Bar graphs and representative histological images of IHC comparing percentage of mammary epithelial cells demonstrating nuclear-localized PGR expression from control untreated, letrozole-treated and tamoxifen-treated Esr1 control: 5.1±2.0, n = 6; letrozole: 3.5±0.9, n = 7; tamoxifen: 11.0±3.5, n = 8; CYP19A1 control: 10.0±2.5, n = 8; letrozole: 4.3±2.3, n = 5; tamoxifen: 14.0±1.4, n = 7. (C) Bar graphs and representative histological images of IHC comparing percentage of mammary epithelial cells demonstrating nuclear-localized cyclin D1 expression from control untreated, letrozole-treated and tamoxifen-treated Esr1 and CYP19A1 overexpressing mice. Esr1 control: 48±10.2, n = 5; letrozole: 69±6.0, n = 8; tamoxifen: 41±10.9, n = 8; CYP19A1 control: 67±4.3, n = 13; letrozole: 36±4.5, n = 11; tamoxifen: 63±10.5, n = 7. (D) Bar graphs and representative histological images of IHC comparing percentage of mammary epithelial cells demonstrating nuclear-localized cyclin E expression from control untreated, letrozole-treated and tamoxifen-treated Esr1 and CYP19A1 overexpressing mice. Esr1 control: 27±5.6, n = 5; letrozole: 36±11.2, n = 5; tamoxifen: 39±7.7, n = 4; CYP19A1 control: 18.2±6.6, n = 6; letrozole: 18±4.2, n = 6; tamoxifen: 31±1.3, n = 4. (E) Bar graphs and representative histological images of IHC comparing percentage of mammary epithelial cells demonstrating nuclear-localized pSTAT3 expression from control untreated, letrozole-treated and tamoxifen-treated Esr1 and CYP19A1 overexpressing mice. Esr1 control: 48±8.1, n = 6; letrozole: 79±5.6, n = 8; tamoxifen: 38±10.3, n = 8; CYP19A1 control: 62±4.9, n = 13; letrozole: 59±11.8, n = 7; tamoxifen: 50±7.2, n = 12. (F) Bar graphs and representative histological images of IHC comparing percentage of mammary epithelial cells demonstrating nuclear-localized pSTAT5 expression from control untreated, letrozole-treated and tamoxifen-treated Esr1 and CYP19A1 overexpressing mice. Esr1 control: 37±13.3, n = 3; letrozole: 84±1.0, n = 5; tamoxifen: 17±5.5, n = 5; CYP19A1 control: 65±0.4, n = 7; letrozole: 23±8.3, n = 6; tamoxifen: 68±17.5, n = 2. *P < 0.05 Mann–Whitney, unpaired, two-tailed. Mean and standard error of the mean indicated. Arrows indicate representative stained mammary epithelial cells. Images taken at ×40. Size bar = 20 µm.
Fig. 3.
Fig. 3.
Transcriptome characterization of Esr1 overexpressing, CYP19A1 overexpressing and Brca1 KO mice by RNA-seq. (A) Bar graphs illustrating the numbers of DEGs in Esr1 overexpressing, CYP19A1 overexpressing and Brca1 KO mice compared with WT mice measured by analysis of RNA-seq data. Numbers of upregulated genes are shown in blue and numbers of downregulated genes are shown in red. (B) The two most significant ontology terms (p< 0.01) are shown for each GEM model. Brca1 KO and Esr1 are defined as tamoxifen-resistant GEM and Cyp19A1 as tamoxifen-sensitive GEM. Genes associated with terms are listed in descending order, highest to lowest, based on relative expression levels. (C) Venn diagrams illustrating the overlap between Esr1, CYP19A1 and Brca1 KO mice for upregulated (blue) and downregulated (red) DEGs. (D) Bar graphs showing relative expression levels of 28 genes with the most marked differences in expression between tamoxifen-sensitive (WT, CYP19A1) and tamoxifen-resistant (Esr1, Brca1 KO) measured in fragments per kilobase of transcript per million mapped reads that are candidate marker genes in tamoxifen-resistant GEM. Both upregulated and downregulated DEGs shown. Gray: WT; black: CYP19A1; red: Esr1; blue: Brca1 KO. (E) Six functionally grouped annotation clusters were defined according to the known and predicted functions of the 68 DEGs upregulated in tamoxifen-resistant Esr1 and Brca1 KO mice but not in tamoxifen-sensitive CYP19A1 mice. Supplementary Table II, available at Carcinogenesis Online, includes detailed information about each circle. (F) Among the 68 genes, 12 genes including Irf7 constituted a highly connected molecular network along with 20 other genes. GeneMANIA and MCODE constructed this network according to several databases including co-expression, co-localization and shared protein domains. (G) Significantly overrepresented TFBSs on the promoter regions of the 68 genes were identified using Pscan with the JASPAR motif database. These include binding sites for IRFs, T-cell acute lymphocytic leukemia 1 (Tal1)::transcription factor 3 (TCF3) and STATs.
Fig. 4.
Fig. 4.
Novel transcripts associated with tamoxifen-resistant Esr1 and Brca1 KO GEM models. (A) Normalized read coverage across the XLOC_010544 and XLOC_00615 loci viewed through the integrative genomics viewer illustrating relative expression levels in WT, CYP19A1, Esr1 and Brca1 KO mice. The potential IRF-binding sites and exon structures of the assembled transcripts (a, b, c, d, e) are indicated. Sequence homology of XLOC_010544 with human IGLL5, human IGLL3P, human IGLL1, rabbit IGLL1 and cow IGLL1 shown. (B) Bar graphs indicating relative probability of coding potential of the novel transcripts assessed using the Coding-Potential Assessment Tool. Transcripts showing coding probability below 0.44 were regarded as non-coding RNAs. *Indicates the three transcripts (a, c, e) with statistically significant scores for coding potential. (C) Bar graphs illustrating relative fragments per kilobase of transcript per 689 million mapped reads of the five different assembled transcripts from the XLOC_010544 and XLOC_00615 loci (a, b, c, d, e) in WT (gray), CYP19A1 (black-outlined gray), Esr1 (white) and Brca1 KO (black) mice.
Fig. 5.
Fig. 5.
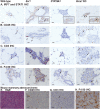
Localization of IRF7, STAT1, CD45, CD3 and F4 80 staining in cells labeled by IHC in mammary gland and adenocarcinoma tissue. (A) Representative histological images of IHC for nuclear-localized IRF7 (large panels) and STAT1 (insets) in mammary epithelial cells from control untreated WT, Esr1 and CYP19A1 overexpressing and Brca1 KO mice. (B) Representative histological images of IHC for membrane-localized CD45 staining in mammary gland tissue from control untreated WT, Esr1 and CYP19A1 overexpressing and Brca1 KO mice. (C) Representative histological images of IHC for predominantly membrane-localized CD3 in mammary gland tissue from control untreated WT, Esr1 and CYP19A1 overexpressing and Brca1 KO mice. (D) Representative histological images of IHC for F4 80 in mammary gland tissue from control untreated WT, Esr1 and CYP19A1 overexpressing and Brca1 KO mice. (E) Representative histological image of hematoxylin and eosin staining of mammary adenocarcinoma tissue from a Brca1 KO mouse. (F) Representative histological image of IHC for CD45 in mammary adenocarcinoma tissue from a Brca1 KO mouse. (G) Representative histological image of IHC for CD3 in mammary adenocarcinoma tissue from a Brca1 KO mouse. (H) Representative histological image of IHC for F4 80 in mammary adenocarcinoma tissue from a Brca1 KO mouse. Arrows indicate representative stained mammary epithelial cells (A), leukocytes (B and F), T cells (C and G), macrophages (D and H). Images taken at ×40. Size bar = 20 µm.
Fig. 6.
Fig. 6.
IRF7 knockdown results in decreased expression of predicted targets PARP14, IRGM1 and GBP7. (A) Representative western blot analysis of IRF7 and actin expression in MCF-7 cells under basal untreated (-), scrambled negative control siRNA (C) and IRF7 siRNA (IRF7) conditions 1 and 3 days following transfection. Size markers are indicated on the gel at left. Arrows at right indicate bands running at the appropriate size for IRF7 (54kDa) and actin (42kDa). Images shown illustrate results for both proteins on the same blot. Images cropped from the original scanned films. (B) Bar graphs showing relative expression levels of IRF7 normalized to actin (mean ± SEM) for basal (-), scrambled negative control siRNA (C) and IRF7 siRNA (IRF7) conditions 3 days after transfection. Relative expression levels under basal (-) conditions set to 1. N = 3 independently performed transfections followed by western blot analyses. (C) Images of ethidium bromide stained agarose gels showing intensity of bands following reverse transcriptase–PCR for primer sets #1 (130bp) and #2 (100bp) for IRF7 at 1:1 and 1:5 dilutions, ACTB (100bp) at 1:1 dilution and GAPDH (100bp) at 1:5 dilution. Molecular weight markers (100–2000bp, exACTGene, low range plus DNA ladder, Fisher Scientific International, Waltham, MA) illustrated at left. Arrows and arrowheads at right of gels indicate position of bands of expected size. *indicates position of non-specific bands. Images shown cropped from original digital images of the gels. (D) Bar graphs showing relative expression levels of PARP14 normalized to actin (mean ± SEM) for basal (-), scrambled negative control siRNA (C) and IRF7 siRNA (IRF7) conditions 3 days after transfection and representative western blots. Relative expression levels under basal (-) conditions set to 1. N = 3 independently performed transfections followed by western blot analyses. Size of products indicated at right (original size markers on gels cropped off). Images show results for both proteins on the same blot, cropped from the original scanned films. (E) Bar graphs showing relative expression levels of IRGM1 normalized to actin (mean ± SEM) for basal (-), scrambled negative control siRNA (C) and IRF7 siRNA (IRF7) conditions 3 days after transfection and representative western blots. Relative expression levels under basal (-) conditions set to 1. N = 3 independently performed transfections followed by western blot analyses. Size of products indicated at right (original size markers on gels cropped off). Images show results for both proteins on the same blot, cropped from the original scanned films. (F) Bar graphs showing relative expression levels of GBP7 normalized to actin (mean ± SEM) for basal (-), scrambled negative control siRNA (C) and IRF7 siRNA (IRF7) conditions 3 days after transfection and representative western blots. Relative expression levels under basal (-) conditions set to 1. N = 3 independently performed transfections followed by western blot analyses. Size of products indicated at right (original size markers on gels cropped off). *indicates position of non-specific bands. Images show results for both proteins on the same blot, cropped from the original scanned films.

Similar articles

Cited by

References

    1. Frech M.S., et al. (2005). Deregulated estrogen receptor alpha expression in mammary epithelial cells of transgenic mice results in the development of ductal carcinoma in situ. Cancer Res., 65, 681–685. - PMC - PubMed
    1. Miermont A.M., et al. (2010). Role of ERalpha in the differential response of Stat5a loss in susceptibility to mammary preneoplasia and DMBA-induced carcinogenesis. Carcinogenesis, 31, 1124–1131. - PMC - PubMed
    1. Díaz-Cruz E.S., et al. (2011). Comparison of increased aromatase versus ERα in the generation of mammary hyperplasia and cancer. Cancer Res., 71, 5477–5487. - PMC - PubMed
    1. Henriksen K.L., et al. (2009). An ER activity profile including ER, PR, Bcl-2 and IGF-IR may have potential as selection criterion for letrozole or tamoxifen treatment of patients with advanced breast cancer. Acta Oncol., 48, 522–531. - PubMed
    1. Miermont A.M., et al. (2012). Association of over-expressed estrogen receptor alpha with development of tamoxifen resistant hyperplasia and adenocarcinomas in genetically engineered mice. Anat. Physiol., 2012 Jun 25; Suppl 12. pii: 001. - PMC - PubMed

Publication types

MeSH terms