. 2014 Nov 25:5:5442.
doi: 10.1038/ncomms6442.

Regulatory network decoded from epigenomes of surface ectoderm-derived cell types

Affiliations

Regulatory network decoded from epigenomes of surface ectoderm-derived cell types

Rebecca F Lowdon et al. Nat Commun. .

Abstract

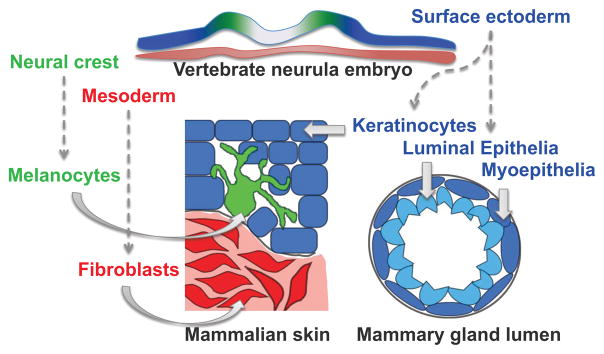
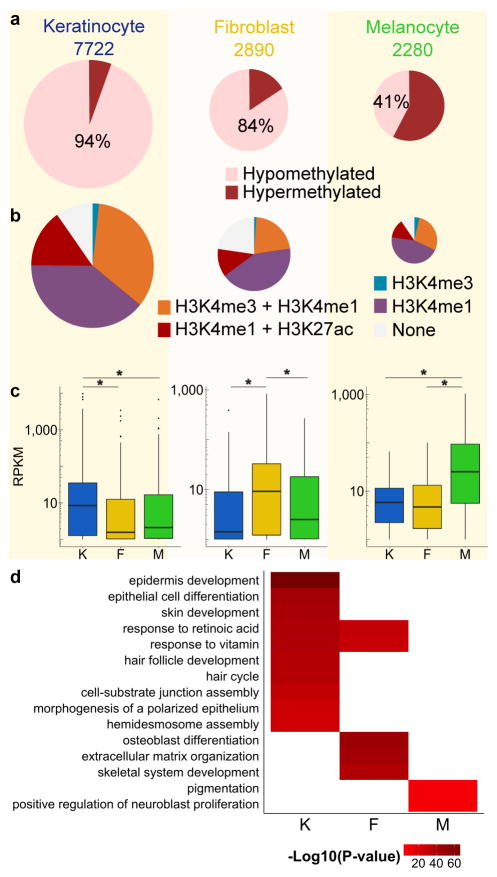
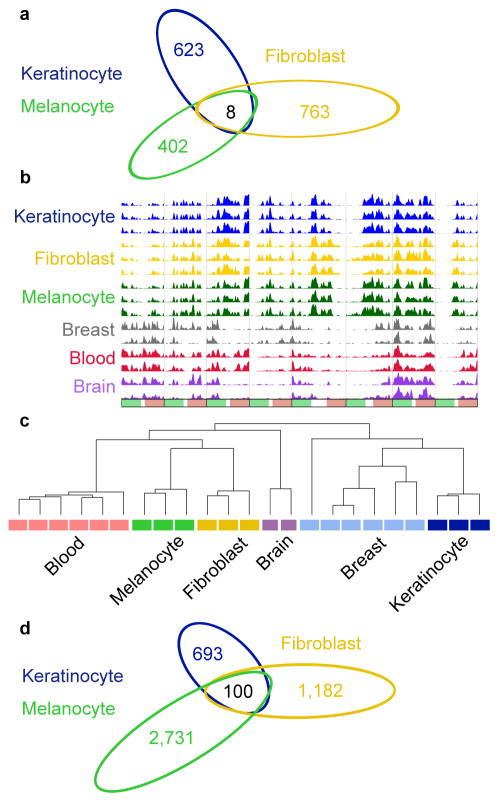
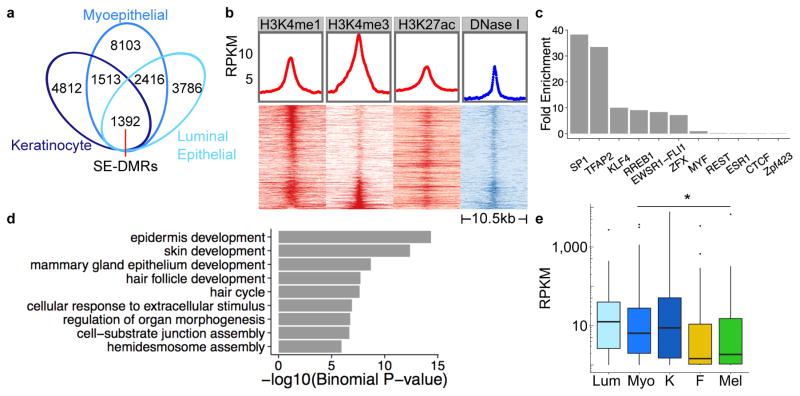
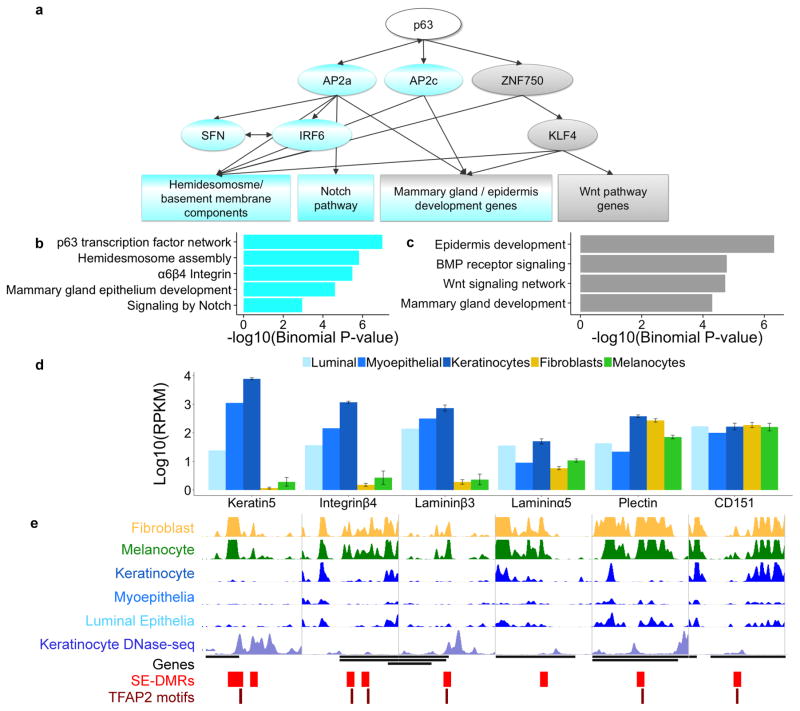
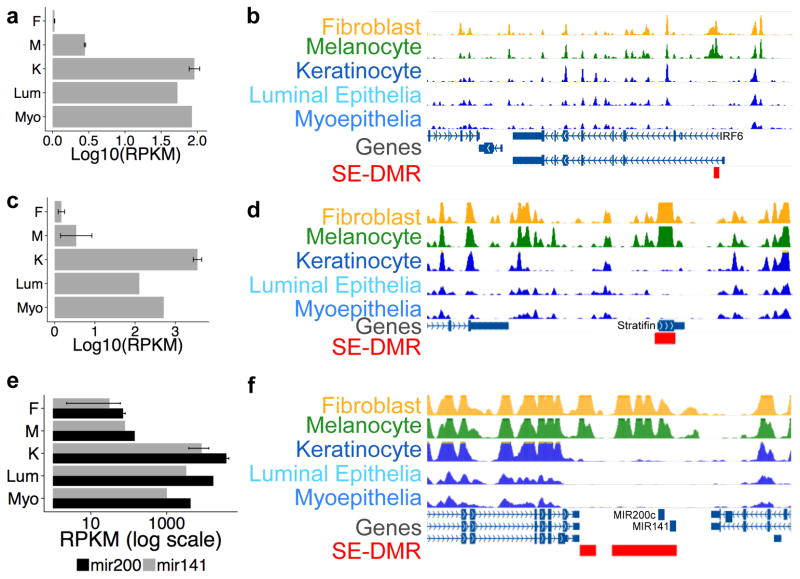
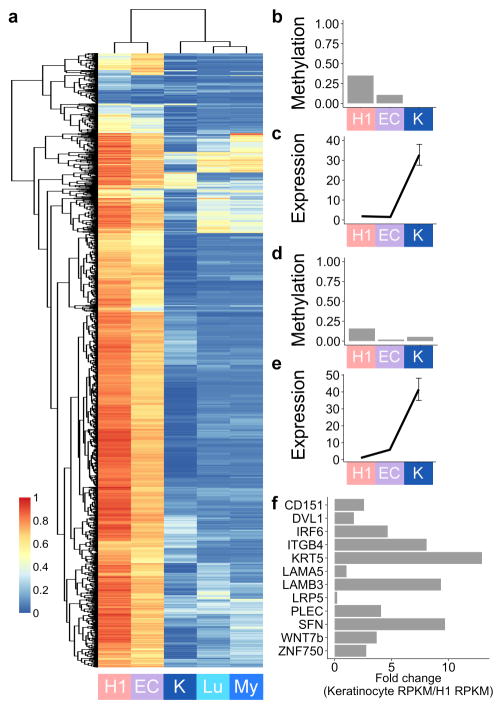
Developmental history shapes the epigenome and biological function of differentiated cells. Epigenomic patterns have been broadly attributed to the three embryonic germ layers. Here we investigate how developmental origin influences epigenomes. We compare key epigenomes of cell types derived from surface ectoderm (SE), including keratinocytes and breast luminal and myoepithelial cells, against neural crest-derived melanocytes and mesoderm-derived dermal fibroblasts, to identify SE differentially methylated regions (SE-DMRs). DNA methylomes of neonatal keratinocytes share many more DMRs with adult breast luminal and myoepithelial cells than with melanocytes and fibroblasts from the same neonatal skin. This suggests that SE origin contributes to DNA methylation patterning, while shared skin tissue environment has limited effect on epidermal keratinocytes. Hypomethylated SE-DMRs are in proximity to genes with SE relevant functions. They are also enriched for enhancer- and promoter-associated histone modifications in SE-derived cells, and for binding motifs of transcription factors important in keratinocyte and mammary gland biology. Thus, epigenomic analysis of cell types with common developmental origin reveals an epigenetic signature that underlies a shared gene regulatory network.


Conflict of interest statement

Competing financial interests

The authors declare no competing financial interests.

Figures

Figure 1
Figure 1. Developmental origins of samples
Developmental origins of skin and breast cell types utilized in this study. Embryonic surface ectoderm from the vertebrate neurula stage embryo (blue) gives rise to keratinocytes in the skin and cells of the mammary gland lumen. Embryonic neural crest cells (green) will produce melanocytes that intercalate with epidermal keratinocytes, and skin fibroblasts are derived from embryonic mesoderm (red).
Figure 2
Figure 2. Identification and characterization of skin cell type-specific DMRs
(a) Hypomethylation and hypermethylation percentages for each set of skin cell type-specific DMRs defined by comparison against the other two skin cell types. The total number for each set of cell type-specific DMRs is listed above the pie chart. DMRs are 500bp windows. (b) Histone modification patterns at skin cell type-specific hypomethylated DMRs. (c) Skin cell type RNA expression levels for genes with hypomethylated cell type-specific DMRs in their promoter regions. Each panel depicts expression values for a set of cell type-specific DMR-associated genes. Plotted values are RNA-seq RPKM values over exons, averaged (mean) over three biological replicates. For each boxplot, the middle line indicates the median value, top and bottom box edges are the third and first quartile boundaries respectively. The upper whisker is the highest data value within 1.5 times the interquartile range; the lower whisker indicates the lowest value within 1.5 times the interquartile range. The interquartile range is the distance between the first and third quartiles. Points indicate data beyond whiskers. Logarithmic scale transformations were applied before boxplot statistics were computed. RPKM distributions for a given set of cell type-specific DMR-associated genes in the specified cell type compared to other cell types were statistically significant (Wilcoxon ranked test, paired, * indicates P-value < 0.003, Keratinocyte-DMRs n = 602, Fibroblast-DMRs n = 108, Melanocyte-DMRs n = 74; K = keratinocytes, F = fibroblasts, M = melanocytes; Supplementary Tables 3–5). (d) Heat map depicting selected gene ontology terms enriched for keratinocyte, fibroblast, and melanocyte hypomethylated cell type-specific DMRs. K = keratinocytes, F = fibroblasts, M = melanocytes. Color intensity represents the negative log10 transformed p-value of enrichment of a given cell type-specific DMR set for association with the listed gene ontology term. Full datasets are in Supplementary Data 3.
Figure 3
Figure 3. Skin-tissue level epigenomic features
(a) Venn diagram showing number of DMRs for each of the skin cell types compared to non-skin samples (brain, breast, and blood). 8 DMRs (overlap region) share the same methylation status in the three skin cell types and have the opposite methylation status in all non-skin samples. (b) WashU Epigenome Browser screenshot of the 8 DMRs where the three skin cell types share the same methylation status and all non-skin cell types have the opposite methylation status. Each column represents a 500bp window +/− 2.5 kb except for two columns which represent multiple contiguous 500bp windows +/− 2.5 kb. Each row is a MeDIP-seq track for the indicated cell type. Three replicates for each skin cell type and two replicates for each non-skin sample are depicted. (c) Clustering dendrogram based on average DNA methylation levels (predicted by methylCRF) at 28,776 DMRs found between skin and brain tissue, breast, and blood cell types. (d) Venn diagram showing number of H3K4me1 peaks for each skin cell type that are absent in all non-skin samples (brain, breast, and blood), which also have overlapping H3K27ac signal. The intersection represents the 100 overlapping regions where H3K4me1 and H3K27ac peaks are present in all three skin cell types and H3K4me1 peaks are absent in all non-skin samples.
Figure 4
Figure 4. Identification and characterization of surface ectoderm-DMRs
(a) Venn diagram showing surface ectoderm-specific DMRs, defined as the overlap of keratinocyte, breast myoepithelial, and luminal epithelial cell DMRs. (b) Enrichment of H3K4me1, H3K4me3, H3K27ac, and DNAse I-hypersensitivity at SE-DMRs. Each heat map column represents histone modification ChIP-seq or DNAse-seq signal at 500bp SE-DMRs +/− 5 kb. Each heat map row represents a single hypomethylated SE-DMR, ordered by decreasing H3K4me1 signal, then increasing H3K4me3 signal. (c) Bar plot of enrichment values for top ten enriched TFBS motifs determined by motif scanning of hypomethylated SE-DMRs using FIMO (Methods). Enrichment based on hg19 genome background. (d) Selected gene ontology terms enriched for hypomethylated surface ectoderm-DMRs. P-value of enrichment calculated by GREAT. Full list of enriched GO terms is in Supplementary Data 5. (e) Box plots showing RNA expression levels for genes with hypomethylated SE-DMRs in promoter regions. Skin cell type RNA-seq RPKM values over exons are averages (mean) of three biological replicates; luminal epithelial and myoepithelial values are a single biological replicate. The middle line indicates the median value, top and bottom box edges are the third and first quartile boundaries respectively. The upper whisker is the highest data value within 1.5 times the interquartile range; the lower whisker indicates the lowest value within 1.5 times the interquartile range. The interquartile range is the distance between the first and third quartiles. Points indicate data beyond whiskers. Logarithmic scale transformation was applied before boxplot statistics were computed. RPKM distributions for SE cell type expression levels vs. non-SE cell type expression levels are statistically significant (Wilcoxon-ranked test, paired, * indicates P-value < 0.02; n = 150 genes; Lum = breast luminal epithelial cells, Myo = breast myoepithelial cells, K= keratinocytes, F = fibroblasts, M = melanocytes; Supplementary Table 6).
Figure 5
Figure 5. Surface ectoderm-DMRs are regulatory elements in a gene network
(a) Summary of the TF-target gene regulatory network derived from SE-DMR analyses. The categories at the bottom of the panel represent enriched biological processes or pathways for genes associated with DMRs containing TFAP2 or KLF4 motifs. TFAP2 associated TFs/pathways highlighted in blue; KLF4 associated pathways in gray. (b) Functional enrichment for TFAP2 motif containing hypomethylated SE-DMRs. (c) Functional enrichment for KLF4 motif containing hypomethylated SE-DMRs. (d) RNA expression values for SE-DMR associated hemidesmosome/basement membrane genes for SE and non-SE cell types. Skin cell type values are averages (mean) of three biological replicates. Error bars are standard error of the mean (s.e.m.). (e) WashU Epigenome Browser screenshot of hemidesmosome/basement membrane genes. MeDIP-seq tracks depicted in green, yellow, and blue; all track y-axes heights are 60 RPKM. DNase-seq track is shown in light blue. Genes depicted as black lines. SE-DMRs depicted as red boxes and TFAP2 motifs as maroon lines.
Figure 6
Figure 6. RNA expression levels and browser screenshots of selected loci with SE-DMRs
(a) Expression values for IRF6 in each cell type as listed on the left. X-axis is expression in RPKM (log10 scale) for each cell type. Skin cell type values are averages (mean) of three biological replicates (error bars are s.e.m.); luminal epithelial and myoepithelial values are a single biological replicate. (b) Browser screenshot of IRF6 locus and surrounding genomic region. MeDIP-seq tracks are shown for the indicated cell types; all track y-axes heights are 60 RPKM. Red box = hypomethylated SE-DMR near the IRF6 promoter. (c) Expression for Stratifin (SFN) as in (a). (d) Browser screenshot of SFN locus. Tracks as in (b). Red box = hypomethylated SE-DMR at SFN promoter. (e) Expression values for mir-200c and mir-141 in each cell type as listed to the left. X-axis is reads per million (RPM, log scale). Keratinocyte value is the average (mean) of three biological replicates; fibroblast value is the mean of two biological replicates, (error bars are s.e.m.); melanocyte, luminal epithelial, and myoepithelial values are a single biological replicate. (f) Browser screenshot of mir-200c/mir-141 locus and surrounding genomic region. Tracks as in (b). Red boxes = hypomethylated SE-DMRs including and adjacent to both miRNA loci.
Figure 7
Figure 7. DNA methylation dynamics of SE-DMRs across samples from different developmental stages
(a) Heatmap and clustering dendrogram based on average CpG DNA methylation values of hypomethylated SE-DMRs for different developmental samples. Each row represents one of 1307 DMRs for which there are CpGs with ≥ 10x coverage in WGBS data. Methylation values for H1 ESCs, ectoderm differentiated ESCs (“EC”), and keratinocyte (“K”) are from WGBS; breast luminal (“Lu”) and myoepithelial (“My”) values are the average of single CpG methylCRF predictions in each DMR. MethylCRF predictions are based on MeDIP-seq and MRE-seq data for these samples (Methods). A value of “1” is fully methylated; “0” is completely unmethylated. (b) KLF4 gene body SE-DMR average CpG DNA methylation levels across developmental stages. (c) KLF4 RNA expression across developmental stages. Values are RPKM over coding exons; error bars for keratinocytes are s.e.m., n = 3. Sample abbreviations as in (a). (d) TFAP2A promoter SE-DMR average CpG DNA methylation levels across developmental stages. (e) TFAP2A RNA expression across developmental stages. Values are RPKM over coding exons; error bars for keratinocytes are s.e.m., n = 3. Sample abbreviations as in (a). (f) RNA expression levels in keratinocytes relative to H1 ESCs for selected genes with hypomethylated SE-DMRs in their promoters. These SE-DMRs, like the majority of hypomethylated SE-DMRs, were methylated in H1 and ectoderm-differentiated ESCs but lowly methylated in differentiated SE cell types. Increased expression relative to an earlier developmental sample suggests these DMRs are transcriptional regulatory regions for their associated genes.

References

    1. Xie W, et al. Epigenomic analysis of multilineage differentiation of human embryonic stem cells. Cell. 2013;153:1134–1148. - PMC - PubMed
    1. Gifford CA, et al. Transcriptional and epigenetic dynamics during specification of human embryonic stem cells. Cell. 2013;153:1149–1163. - PMC - PubMed
    1. Lister R, et al. Global epigenomic reconfiguration during mammalian brain development. Science. 2013;341:1237905. - PMC - PubMed
    1. Zhang B, et al. Functional DNA methylation differences between tissues, cell types, and across individuals discovered using the M&M algorithm. Genome Res. 2013;23:1522–1540. - PMC - PubMed
    1. Schlesinger F, et al. De novo DNA demethylation and noncoding transcription define active intergenic regulatory elements. Genome Res. 2013;23:1601–1614. - PMC - PubMed

Publication types

Associated data