. 2014 Dec 9;111(49):E5252-61.
doi: 10.1073/pnas.1411683111. Epub 2014 Nov 24.

Actin stress in cell reprogramming

Affiliations

Actin stress in cell reprogramming

Jun Guo et al. Proc Natl Acad Sci U S A. .

Abstract

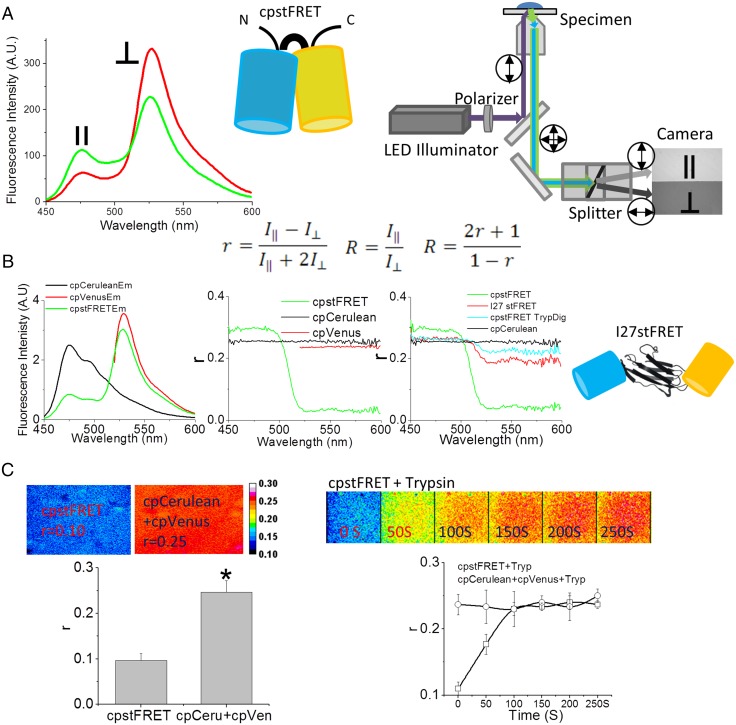
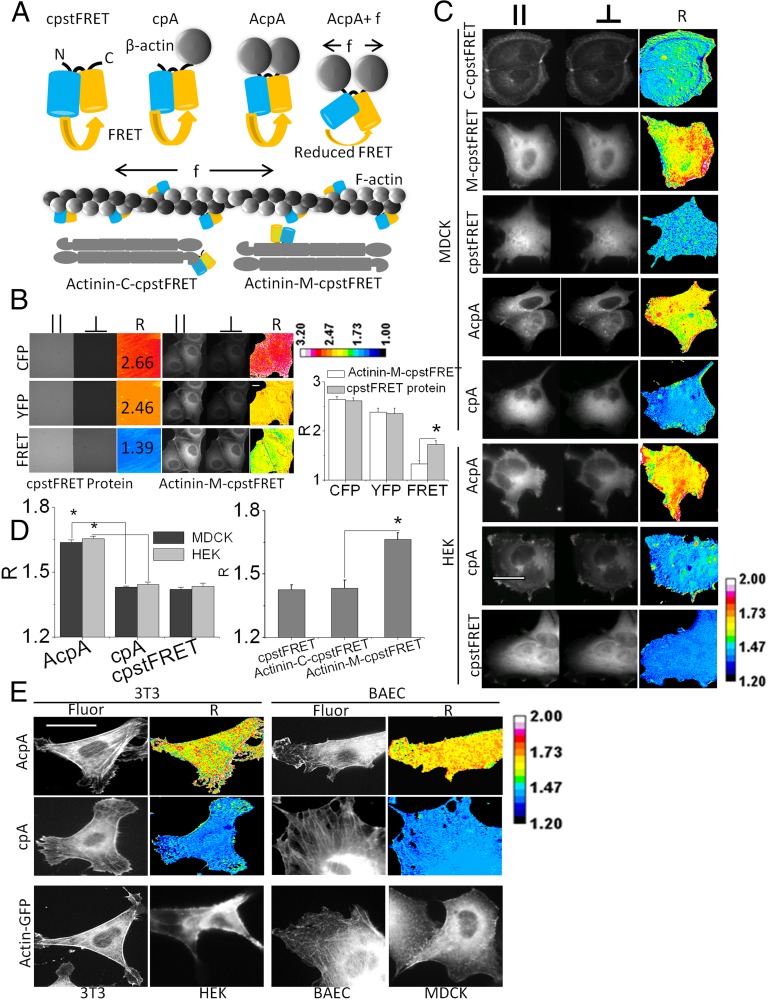
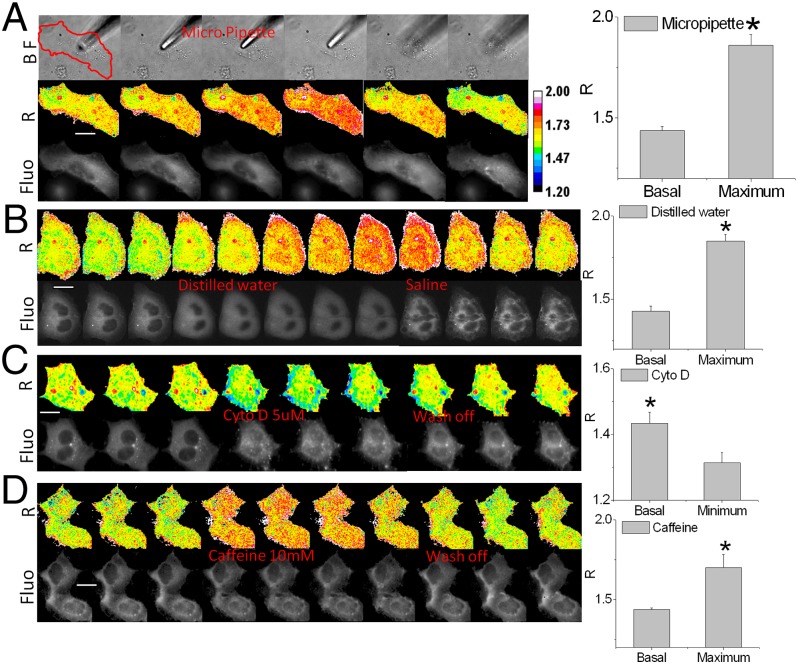
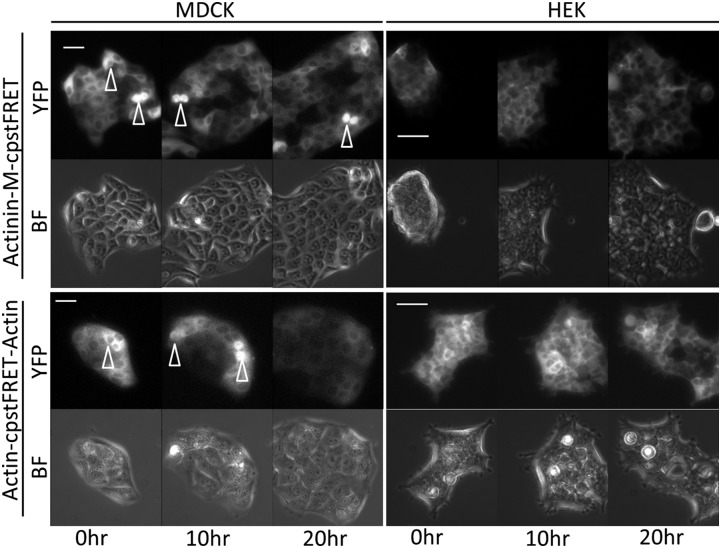
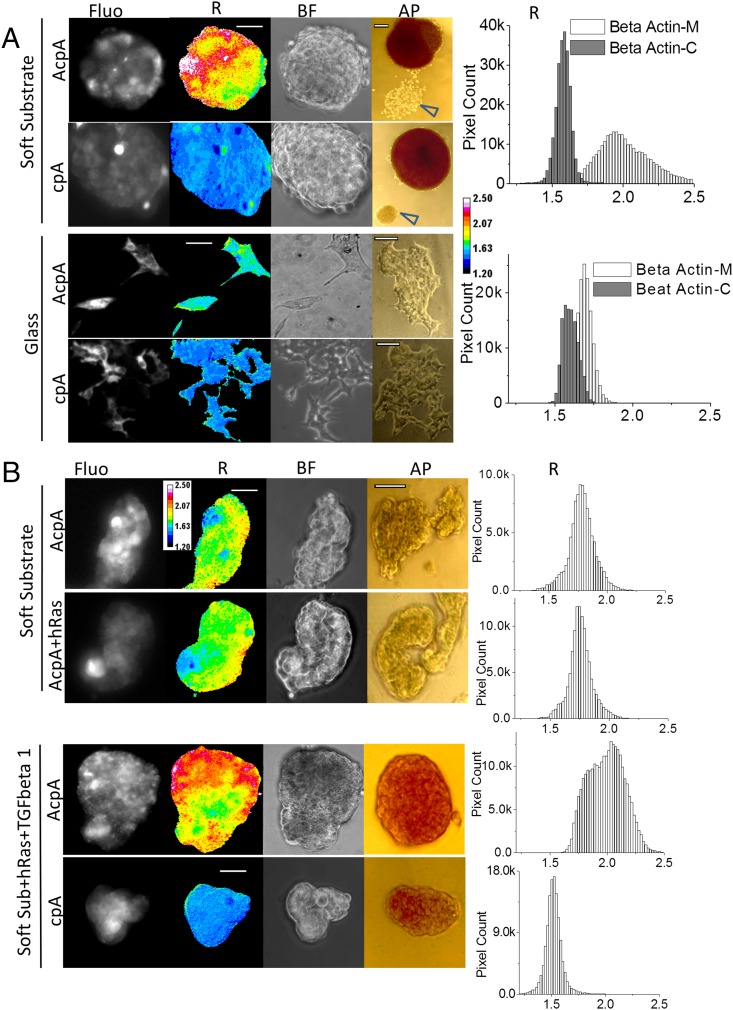
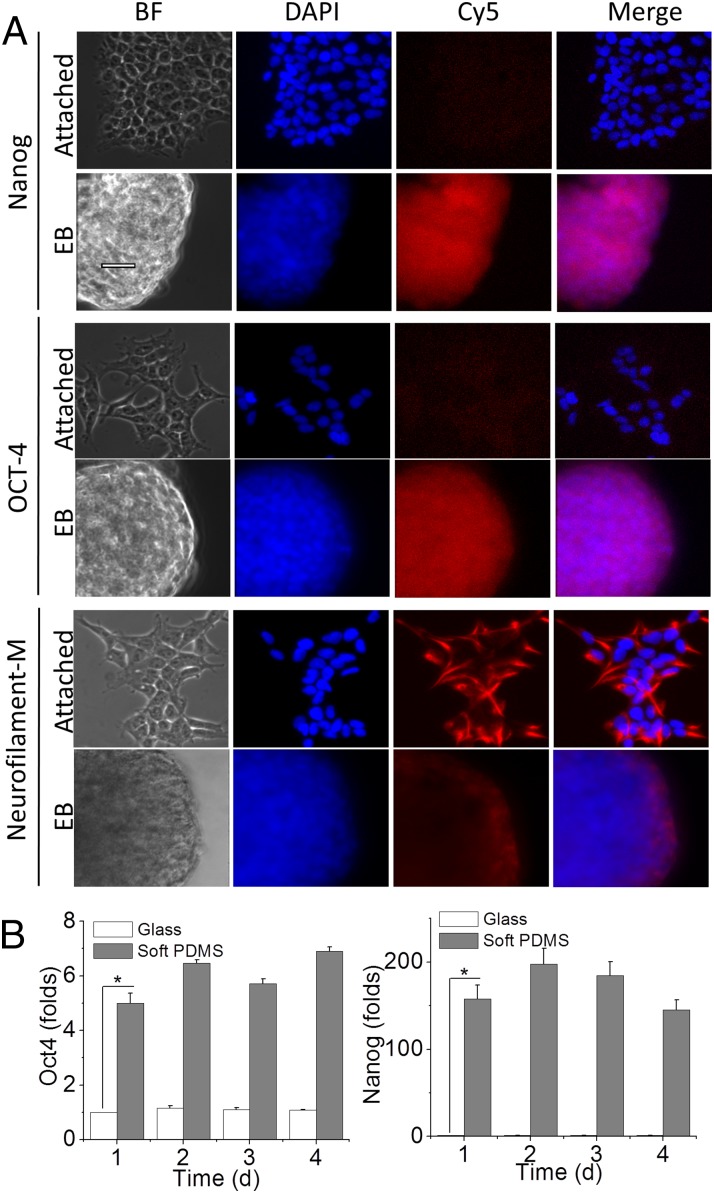
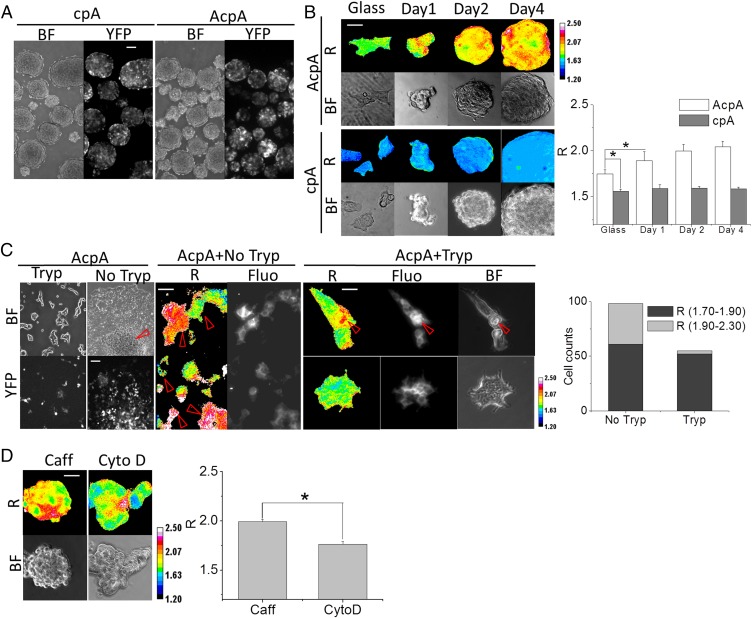
Cell mechanics plays a role in stem cell reprogramming and differentiation. To understand this process better, we created a genetically encoded optical probe, named actin-cpstFRET-actin (AcpA), to report forces in actin in living cells in real time. We showed that stemness was associated with increased force in actin. We reprogrammed HEK-293 cells into stem-like cells using no transcription factors but simply by softening the substrate. However, Madin-Darby canine kidney (MDCK) cell reprogramming required, in addition to a soft substrate, Harvey rat sarcoma viral oncogene homolog expression. Replating the stem-like cells on glass led to redifferentiation and reduced force in actin. The actin force probe was a FRET sensor, called cpstFRET (circularly permuted stretch sensitive FRET), flanked by g-actin subunits. The labeled actin expressed efficiently in HEK, MDCK, 3T3, and bovine aortic endothelial cells and in multiple stable cell lines created from those cells. The viability of the cell lines demonstrated that labeled actin did not significantly affect cell physiology. The labeled actin distribution was similar to that observed with GFP-tagged actin. We also examined the stress in the actin cross-linker actinin. Actinin force was not always correlated with actin force, emphasizing the need for addressing protein specificity when discussing forces. Because actin is a primary structural protein in animal cells, understanding its force distribution is central to understanding animal cell physiology and the many linked reactions such as stress-induced gene expression. This new probe permits measuring actin forces in a wide range of experiments on preparations ranging from isolated proteins to transgenic animals.

Keywords: actin; cell mechanics; force probe; reprogramming; stem cell.


Conflict of interest statement

The authors declare no conflict of interest.

Figures

Fig. 1.
Fig. 1.
Fluorescence anisotropy is a sensitive method to detect FRET changes in cpstFRET. (A) Schematic diagram of the cpstFRET force sensor and the microscope setup. (Left) cpstFRET anisotropy scanned by a spectrofluorimeter; ‖, emission parallel to excitation; ⊥, emission perpendicular to excitation. (Middle) The cyan barrel represents cpCerulean, and the yellow barrel represents cpVenus. (Right) The wide-field fluorescence microscope setup for anisotropy measurements. Double-headed arrows indicate the polarization in the light path. (Equation Inset) R, anisotropy FRET ratio; r, anisotropy. (B) Anisotropy measured by spectrofluorimeter. (Left) The emission spectra of a purified protein solution of cpstFRET (green), cpVenus (red), and cpCerulean (black). (Middle) The emission spectral anisotropy of the three protein solutions. (Right) The anisotropy of cpCerulean (black), cpstFRET (green), cpstFRET after cleavage of the linker by trypsin for 20 s (cyan), and I27stFRET (red). Schematic diagram shows I27stFRET, with I27 as the linker between cpVenus and cpCerulean. (C) cpstFRET protein solution anisotropy measured in the microscope. (Left) FRET anisotropy, r, images of free-floating dilute probe cpstFRET (r = 0.1) and cpCerulean and cpVenus in a 1:1 ratio with no visible FRET (r = 0.25). (Right) R images of cpstFRET protein with linker cleaved by trypsin up to 250 s. All images were processed and pseudocolored by the 16-color map of ImageJ. The calibration bar was set from 0.08 to 0.30.
Fig. 2.
Fig. 2.
Actin–cpstFRET–Actin and actinin–M–cpstFRET report force in actin and the actin cross-linker actinin. (A) Schematic diagram of actin–cpstFRET and actinin–cpstFRET chimeric constructs. cpA, cpstFRET–β-actin with one actin molecule attached to the C-terminal of cpstFRET; AcpA, Actin–cpstFRET–Actin with one actin molecule attached on each end of cpstFRET. f indicates force, which expands the structure of cpstFRET and leads to a reduction of FRET. The f-actin cartoon only presents what we expect to be the dominant configuration of probe incorporation and does not intend to exclude incorporation into cross-links. Actinin–C–cpstFRET/C–cpstFRET represents C-terminal–tagged actinin (force-free); Actinin–M–cpstFRET/M–cpstFRET represents actinin with the sensor incorporated in the middle of the host. (B) Comparison of the anisotropy ratio R of purified cpstFRET protein in solution and in the actinin host in MDCK cells. R is calculated from parallel and perpendicular polarizations using the equations shown in Fig. 1. The R images are presented in a 16-pseudocolor map with a range from 1.0 to 3.2. (Scale bar, 20 μm.) Histograms show R from cpstFRET protein and actinin–M–cpstFRET, n ≥ 3. P < 0.05 by Student t test. (C) cpstFRET reporting constitutive tension in actin and actinin in HEK and MDCK cells. MDCK cells expressed Actinin–M–cpstFRET, Actinin–C–cpstFRET, cpstFRET, AcpA, and cpA. HEK expressed cpstFRET, AcpA, and cpA. High R means high stress and vice versa. (D) Histogram plot of R for HEK and MDCK cells. P < 0.05 by Student t test. (E) 3T3 and BAEC cell expressing force-free cpA or AcpA and HEK, MDCK, 3T3, and BAEC expressing Actin–GFP. Fluor, YFP fluorescence channel acquired from acceptor Venus R ratio image indicates force levels. R images are presented in ImageJ 16-pseudocolor map with a range of 1.2–2.0. (Scale bar, 20 μm.)
Fig. 3.
Fig. 3.
cpstFRET reports changes in actin force in response to mechanical and chemical stimuli. (A) MDCK cells expressing AcpA were indented by a micropipette; the red line outlines the cell. Fluo, FRET image of the cell; R, anisotropy ratio images showing force in actin. (The experiments were repeated n ≥ 5.) Histograms show maximum changes in the ratio R (P < 0.05 by Student t test). (B) MDCK cells challenged by anisotonic osmotic pressure. Replacing Hepes buffer with distilled water swelled the cells and increased force in actin, and returning them to saline shrank the swollen cells and lowered stress below resting levels in places (green). (C) HEK AcpA cells treated with 5 μM of cytochalasin D. (D) HEK AcpA cells treated with 10 mM of caffeine to elevate calcium Ca+2 and induce contraction. Each experiment was repeated n ≥ 5. Histograms on the right show the maximum ratio R changes under each condition. P < 0.05 by Student's t test, calibration bar with 16-color map. (Scale bar, 20 μm.)
Fig. 4.
Fig. 4.
Stable cell lines expressing actin-sensor and actinin-sensor chimeras show normal cell physiology. We created 13 cell lines (Table S1). The MDCK and HEK stable cell lines were cultured in media in a 5% CO2 chamber on a heated stage. A 20-h time lapse sequence from each cell line was used to monitor cell proliferation (BF, bright field; YFP, YFP channel signal from cpVenus). Using the Zeiss Definite Focus, we monitored at least five cell colonies simultaneously. Arrowheads indicate the dividing cells. All cells went through mitosis and proliferation. (Scale bar, 50 μm.)
Fig. 5.
Fig. 5.
Actin force elevation in stem-like cells reprogrammed from HEK and MDCK stable cell lines. (A) HEK actin stable cell lines cultured on soft substrate (PDMS) and glass. AcpA, HEK stable line expressing actin–cpstFRET–actin; AP, alkaline phosphatase staining of EBs and cells; BF, bright-field images of EBs and cells; cpA, HEK stable line expressing cpstFRET–actin; Fluo, FRET signal; R, anisotropy ratio representing tension in actin. Arrowheads indicate HEK cells attached to the substrate showing no AP activity, and these cells were not reprogrammed. Pixel count distribution plots on the right were generated from all pixels from >10 R images. R images are presented with a 16-color map of 1.20–2.50. (Scale bar, 50 μm.) (AP scale bar, 100 μm.) (B) MDCK actin stable cell lines cultured on soft substrate (PDMS). AcpA, MDCK stable line expressing actin–cpstFRET–actin cassette; cpA, MDCK stable line expressing cpstFRET–actin; +hRas, MDCK stable cell lines expressing hRas gene; +TGFbeta 1, cell cultures were supplied with 5 μg/mL TGF-β1. hRas MDCK stable lines were derived from MDCK AcpA or cpA stable cell lines. Pixel count distribution plots on the right were created using all pixel values from at least 10 R images. R images are presented with a 16-color map of Image J with a range of 1.20–2.50. (Scale bar, 50 μm.) (AP scale bar, 100 μm.)
Fig. 6.
Fig. 6.
Stem cell markers in HEK-derived EBs. (A) HEK cells cultured on a coverslip (attached) and PDMS (EB, embryonic body) were immunostained with anti-Nanog, OCT4, and Neurofilament-M antibodies. Then, the cells were treated with secondary antibodies conjugated with Cy5. The nuclei were stained with DAPI. BF, bright field. (Scale bar, 50 μm.) (B) Real-time RT-PCR of HEK cultured on coverslip glass and soft PDMS for 1, 2, 3, and 4 d. The histogram shows the average fold of increase of OCT4 and Nanog from three sets of independently prepared samples at each time point (*P < 0.05 by Student t test).
Fig. 7.
Fig. 7.
Actin stress in dedifferentiated HEK cells and stemness retention. (A) HEK force-free cpA and AcpA cultured on PDMS for 3 d (BF, bright field; YFP, YFP channel fluorescence). (Scale bar, 100 μm.) (B) Time course of R in HEK cpA and AcpA cells. R, the anisotropy ratio is positively correlated to force. Histograms show the average R of five images at each time point. (Scale bar, 50 μm.) P < 0.05 by Student t test. (C) HEK AcpA cells cultured on a coverslip. AcpA HEK EBs were transferred to coverslips with (Tryp) or without trypsin (No Tryp) treatment. BF and YFP channels show the attached cells and fluorescence. AcpA+NoTryp displays R in attached cells derived from EBs without trypsin digestion; AcpA+Tryp displays R of two clusters of HEK cells differentiated from cells from trypsinized EBs. (Scale bar, 50 μm.) The histogram gives the proportion of high-force versus low-force cells from the two groups of HEK cells derived from trypsinized and nontrypsinized EBs. (D) HEK AcpA cells cultured on PDMS and supplied with Caff (caffeine) and CytoD (cytochalasin D). The histogram shows the average R of five images from each condition. (Scale bar, 50 μm.) P < 0.05 by Student t test. All R images have a 16-color map of 1.20–2.50.

References

    1. Bustamante C, Chemla YR, Forde NR, Izhaky D. Mechanical processes in biochemistry. Annu Rev Biochem. 2004;73:705–748. - PubMed
    1. Meng F, Suchyna TM, Sachs F. A fluorescence energy transfer-based mechanical stress sensor for specific proteins in situ. FEBS J. 2008;275(12):3072–3087. - PMC - PubMed
    1. Li D, et al. Role of mechanical factors in fate decisions of stem cells. Regen Med. 2011;6(2):229–240. - PMC - PubMed
    1. Discher DE, Janmey P, Wang YL. Tissue cells feel and respond to the stiffness of their substrate. Science. 2005;310(5751):1139–1143. - PubMed
    1. Johnson CP, Tang HY, Carag C, Speicher DW, Discher DE. Forced unfolding of proteins within cells. Science. 2007;317(5838):663–666. - PMC - PubMed

Publication types

MeSH terms