. 2014 Nov 20;6(11):90.
doi: 10.1186/s13073-014-0090-6. eCollection 2014.

SRST2: Rapid genomic surveillance for public health and hospital microbiology labs

Affiliations

SRST2: Rapid genomic surveillance for public health and hospital microbiology labs

Michael Inouye et al. Genome Med. .

Abstract

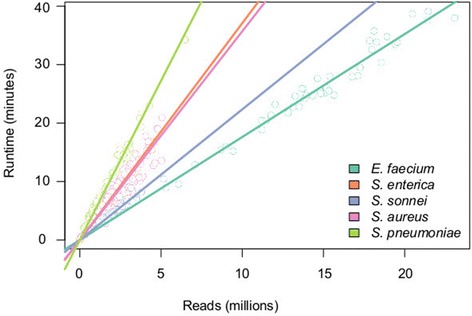
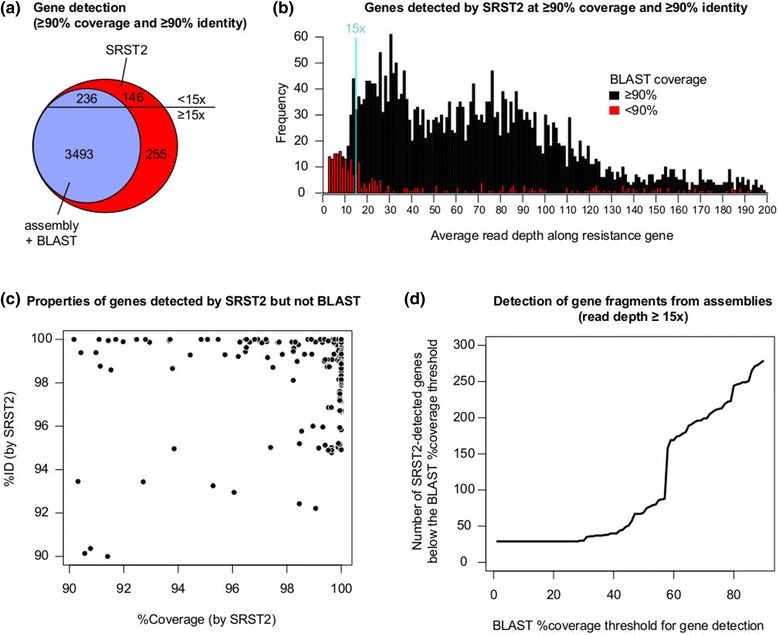
Rapid molecular typing of bacterial pathogens is critical for public health epidemiology, surveillance and infection control, yet routine use of whole genome sequencing (WGS) for these purposes poses significant challenges. Here we present SRST2, a read mapping-based tool for fast and accurate detection of genes, alleles and multi-locus sequence types (MLST) from WGS data. Using >900 genomes from common pathogens, we show SRST2 is highly accurate and outperforms assembly-based methods in terms of both gene detection and allele assignment. We include validation of SRST2 within a public health laboratory, and demonstrate its use for microbial genome surveillance in the hospital setting. In the face of rising threats of antimicrobial resistance and emerging virulence among bacterial pathogens, SRST2 represents a powerful tool for rapidly extracting clinically useful information from raw WGS data. Source code is available from http://katholt.github.io/srst2/.


Figures

Figure 1
Figure 1
Summary of SRST2 approach. Inputs are reads (fastq format) and one or more databases of reference allele sequences for typing (fasta format). Reads are aligned to all reference sequences (using bowtie2) and each alignment processed (using SAMtools). At each position in each alignment, the number of matching and mismatching bases is determined and a binomial test is performed to assess the evidence against the reference allele; resulting in a set of P values for each reference allele sequence. To determine which of all known reference alleles is most likely present at a given locus, the P value distributions for known alleles are compared as described in the text. Briefly, for each allele the P values expected if the reads were derived from the reference allele in the presence of a given level of sequencing error (set to 1% of bases by default) are regressed on those actually observed, similar to a Q-Q plot; the slope of the fitted line, which increases with the strength of evidence against the reference allele, is calculated and taken as the score for that allele. The scores file (optional output) contains the scores for each allele at each locus, along with additional information about the alignments for each allele including percent coverage. For each locus, the allele with the lowest score is accepted as the closest matching allele (small arrows) and reported in the output table. In MLST mode, sequence type (ST) definitions are provided as input and used by SRST2 to calculate STs for each read set.
Figure 2
Figure 2
Run times for MLST analysis with SRST2. Lines are linear regression of runtime on reads, calculated separately for each species from public data sets (details in Table 1).
Figure 3
Figure 3
Overall accuracy of SRST2 allele calling and gene detection. (a) MLST analysis of public data from five species (N = 543 genomes, 3,801 loci, details Additional file 1: Table S1). Tests were grouped by read depth and accuracy rates (left y-axis, correct allele calls as a proportion of tests), calculated at each depth (x-axis, red slashes indicate scale change). Grey bars, number of tests at each depth (right y-axis); Lines, accuracy of allele calling. (b) MLST analysis of Listeria monocytogenes data (N = 231 genomes, 1,671 loci) conducted in a public health laboratory; colours and axes as in (a). (c) Accuracy of vanB resistance gene detection for E. faecium read sets subsampled to low depth; y-axis shows proportion of correct (presence vs. absence) calls as a proportion of 100 tests at each depth; colours and axes as in (a). A call of ‘present’ implies detection of ≥90% of the length of the gene at ≥90% nucleotide identity.
Figure 4
Figure 4
Accuracy of SRST2 allele calling at low read depths and with expanded MLST database size. MLST analysis of public S. aureus data. (N = 10 read sets; each sampled 100 times to different depths; details in Methods). Tests were grouped by read depth and accuracy rates (y-axis, correct allele calls as a proportion of all tests), calculated at each depth (x-axis, red slashes indicate scale change from 1× to 10×). Red, real S. aureus MLST database; blue, expanded S. aureus MLST database (see Methods); grey, unsampled data from five species mapped to real databases (as shown in Figures 1 and 3).
Figure 5
Figure 5
Resistance gene detection. (a) Venn diagram of antimicrobial resistance genes detected by SRST2 and assembly + BLAST, where the threshold for ‘detection’ of a gene is ≥90% coverage and ≥90% identity with a reference allele. No genes were detected by assembly + BLAST but not SRST2. (b) Distribution of average read depths per gene, calculated by SRST2 from mapped reads, for all genes detected by SRST2. (c) Coverage and nucleotide identity (%ID), as calculated by SRST2, for all genes detected by SRST2 but not by assembly + BLAST. (d) Impact of lowering the coverage threshold for detection of genes by BLAST (for those genes with ≥15× read depth).
Figure 6
Figure 6
SRST2 analysis of sequence types and beta-lactamase CTX-M-15 genes among hospital isolates. Rates of isolation of different sequence types (STs), coloured by CTX-M-15 status, as determined by SRST2 run with default parameters on a public data set of strains from a single hospital. In each species, a single known ST dominates the population (highlighted) and is also the dominant source CTX-M-15 genes. ‘*’ next to an ST indicates a match to the closest defined ST; that is, that for all seven loci the closest known allele is the one belonging to that ST, however at ≥1 these loci there is an imprecise match (SNP or indel) compared to the known allele sequence. ‘Novel’ indicates a novel sequence type resulting from a combination of known alleles, with precise matches at all loci (‘NF’ in SRST2 output); ‘Novel*’ indicates a novel combination of alleles, with ≥1 of those alleles being novel itself (that is, with no exact match in the MLST database) (‘NF*’ in SRST2 output).
Figure 7
Figure 7
SRST2 analysis of E. faecium hospital data and hospital outbreak investigation. Temporal distribution of isolates is shown in (a) coloured by vancomycin resistance as inferred from vanA-B detection with SRST2, and in (b) by coloured by sequence type inferred by SRST2. (c) Summary of all SRST2 results by sequence type (ST), in order from left to right: single linkage clustering of STs by number of shared alleles; MLST allele profiles; heatmap indicating the proportion of isolates that carries each resistance gene (scale as indicated), frequency of the ST (axis as indicated, coloured as in (b)).
Figure 8
Figure 8
SRST2 analysis of hospital outbreak investigation. (a) Isolate genetic profiles obtained from SRST2 analysis, indicating that case EF4 was distinct in both sequence type and resistance gene profile from the outbreak cases EF2 and EF3. Full WGS analysis showed a similar result [15]. (b) Isolate genetic profiles obtained from SRST2 analysis, including plasmid replicons detected (pink). The profiles indicate that case EC3 shared the same sequence type as the linked cases EC1 and EC2 (ST94), but lacked the IncA/C plasmid and had a distinct resistance gene profile. Full WGS analysis showed that EC1 and EC2 isolates were much closer to each other (≤22 SNPs) than to EC3 (>150 SNPs) [15].

References

    1. Sabat AJ, Budimir A, Nashev D, Sa-Leao R, van Dijl J, Laurent F, Grundmann H, Friedrich AW, Markers ESGoE: Overview of molecular typing methods for outbreak detection and epidemiological surveillance.Euro Surveill 2013, 18:20380. - PubMed
    1. Bertelli C, Greub G. Rapid bacterial genome sequencing: methods and applications in clinical microbiology. Clin Microbiol Infect. 2013;19:803–813. doi: 10.1111/1469-0691.12217. - DOI - PubMed
    1. Maiden MC. Multilocus sequence typing of bacteria. Annu Rev Microbiol. 2006;60:561–588. doi: 10.1146/annurev.micro.59.030804.121325. - DOI - PubMed
    1. Gilmour MW, Graham M, Reimer A, Van Domselaar G. Public health genomics and the new molecular epidemiology of bacterial pathogens. Public Health Genomics. 2013;16:25–30. doi: 10.1159/000342709. - DOI - PubMed
    1. Pallen MJ, Loman NJ, Penn CW. High-throughput sequencing and clinical microbiology: progress, opportunities and challenges. Curr Opin Microbiol. 2010;13:625–631. doi: 10.1016/j.mib.2010.08.003. - DOI - PubMed