. 2014 Nov 25;9(11):e113071.
doi: 10.1371/journal.pone.0113071. eCollection 2014.

Predictive gene signatures: molecular markers distinguishing colon adenomatous polyp and carcinoma

Affiliations

Predictive gene signatures: molecular markers distinguishing colon adenomatous polyp and carcinoma

Janice E Drew et al. PLoS One. .

Abstract

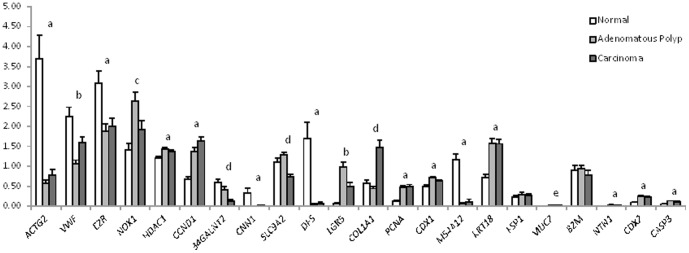
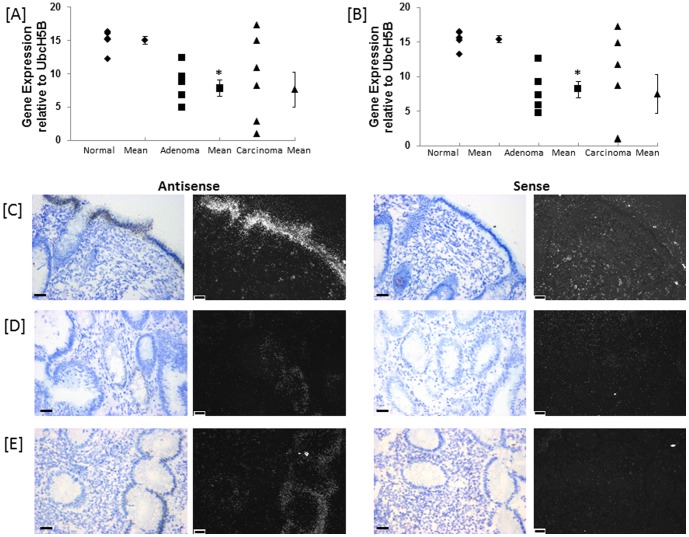
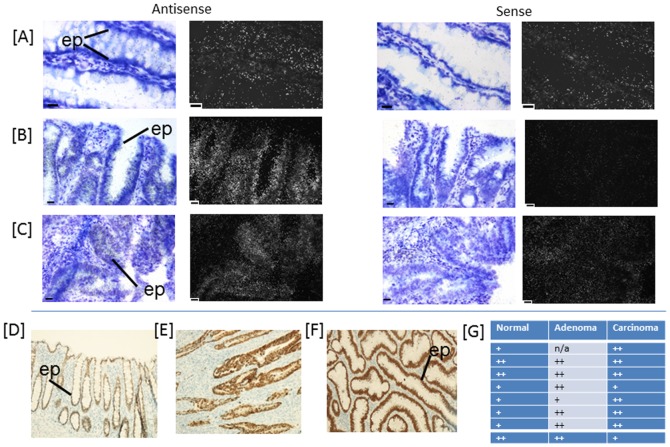
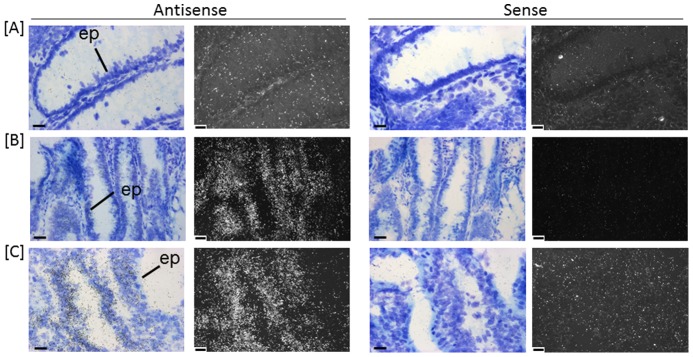
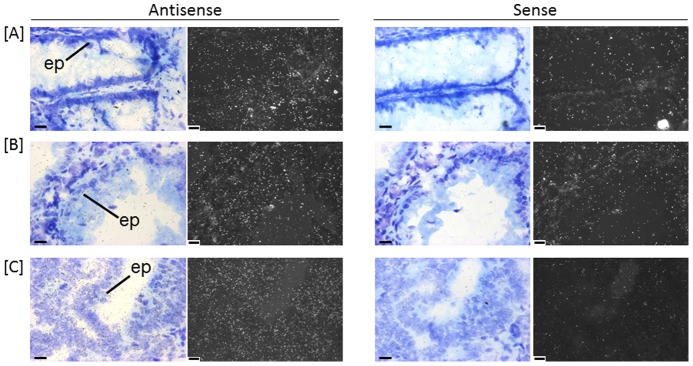
Cancers exhibit abnormal molecular signatures associated with disease initiation and progression. Molecular signatures could improve cancer screening, detection, drug development and selection of appropriate drug therapies for individual patients. Typically only very small amounts of tissue are available from patients for analysis and biopsy samples exhibit broad heterogeneity that cannot be captured using a single marker. This report details application of an in-house custom designed GenomeLab System multiplex gene expression assay, the hCellMarkerPlex, to assess predictive gene signatures of normal, adenomatous polyp and carcinoma colon tissue using archived tissue bank material. The hCellMarkerPlex incorporates twenty-one gene markers: epithelial (EZR, KRT18, NOX1, SLC9A2), proliferation (PCNA, CCND1, MS4A12), differentiation (B4GANLT2, CDX1, CDX2), apoptotic (CASP3, NOX1, NTN1), fibroblast (FSP1, COL1A1), structural (ACTG2, CNN1, DES), gene transcription (HDAC1), stem cell (LGR5), endothelial (VWF) and mucin production (MUC2). Gene signatures distinguished normal, adenomatous polyp and carcinoma. Individual gene targets significantly contributing to molecular tissue types, classifier genes, were further characterised using real-time PCR, in-situ hybridisation and immunohistochemistry revealing aberrant epithelial expression of MS4A12, LGR5 CDX2, NOX1 and SLC9A2 prior to development of carcinoma. Identified gene signatures identify aberrant epithelial expression of genes prior to cancer development using in-house custom designed gene expression multiplex assays. This approach may be used to assist in objective classification of disease initiation, staging, progression and therapeutic responses using biopsy material.


Conflict of interest statement

Competing Interests: The authors have declared that no competing interests exist.

Figures

Figure 1
Figure 1. Multivariate discriminant analysis of the UBE2D2 normalised gene GeXP hCellMarkerPlex data from human colon normal (white triangle) (n = 24), adenomatous polyp (grey triangle) (n = 17) and carcinoma (black triangle) (n = 19) tissues.
Information on the gene symbols on the biplot is available in Table S2. (A) Principal component analysis (PCA) biplot permits visualisation of inherent clustering patterns of individual tissue samples and associated gene expression levels. (B) Orthogonal Partial Least Squares Discriminant Analysis (OPLS-DA) was applied to fit a 2-class supervised model maximising covariance and discriminating gene expression profiles associated with the different tissues sample types; the biplot shows scores and loadings as well as the regression coefficients best explaining each class ($M4.DA(N),$M4.DA(A),$M4.DA(C). (C) Rank of importance of cell marker genes within the OPLS-DA. (D) Matrix showing the associated misclassification rates.
Figure 2
Figure 2. Relative gene expression levels in human colon normal, adenomatous polyp and carcinoma tissue generated using the GeXP hCellMarkerPlex assay.
Gene expression is normalised to internal reference gene UBE2D2 in the hCellMarkerPlex. The letters indicate significant (p<0.05) difference in gene expression between ‘a’ normal (n = 24) and either adenomatous polyp (n = 17) or carcinoma (n = 19), ‘b’ normal, adenomatous polyp and carcinoma, ‘c’ normal and carcinoma, ‘d’ normal and adenomatous polyp and ‘e’ carcinoma and either normal of adenomatous polyp.
Figure 3
Figure 3. Gene expression of (A) long and (B) short form variants of MS4A12 in human colon normal, adenomatous polyp and carcinoma tissue.
Gene expression is normalised to reference gene UBE2D2. The asterisk (*) indicates significant decrease in expression levels of adenomatous polyp compared to normal, p<0.005. (C) – (D). In situ hybridisation of MS4A12 transcripts in human colon (C) normal, (D) adenomatous polyp and (E) carcinoma. Emulsion autoradiographs showing expression of MS4A12 at luminal epithelial surface (ep) of normal (C) in bright field and corresponding dark field images in antisense (left) and sense (right) hybridised tissue sections (n = 5). MS4A12 is largely absent in adenomatous polyp (D) and localised in discrete areas of epithelium in carcinoma (E). Bar = 20 µm.
Figure 4
Figure 4. In situ hybridisation of LGR5 transcripts in human colon (A) normal, (B) adenomatous polyp and (C) carcinoma.
Emulsion autoradiographs showing expression of LGR5 in discrete single cells (arrow) in epithelium (ep) in normal (A) and extensive expression in epithelium (ep) of adenomatous polyp (B) and carcinoma (C) in bright field and corresponding adjacent dark field images. Antisense hybridised tissue sections are shown to the left with sense hybridised tissue sections adjacent to the right (n = 5). Bar = 20 µm.
Figure 5
Figure 5. Localisation of CDX2 transcripts and encoded protein in human colon.
In situ hybridisation of CDX2 transcripts in human colon (A) normal, (B) adenomatous polyp and (C) carcinoma. Emulsion autoradiographs showing expression of CDX2 in epithelium (ep) in bright field and corresponding adjacent dark field images in antisense (left) and sense (right) hybridised tissue sections (n = 5). Bar = 20 µm. (D) – (F) Representative paraffin-embedded tissue sections show immunohistochemical localisation of CDX2 expression in the human colon epithelium in (D) normal, (E) adenomatous polyp and (F) carcinoma. (G) Semi-quantitative scoring of staining intensity (increasing from + to +++) revealed increased immunostaining for CDX2 in adenomatous polyp and carcinoma (n = 8). Scoring system: + (detectable nuclear staining, weak), ++ (easily visible nuclear staining), n/a – no adenoma tissue in histological section.
Figure 6
Figure 6. In situ hybridisation of NOX1 transcripts in human colon (A) normal, (B) adenomatous polyp and (C) carcinoma.
Emulsion autoradiographs showing expression of NOX1 in epithelium (ep) in bright field and corresponding adjacent dark field images in antisense (left) and sense (right) hybridised tissue sections (n = 5). Bar = 20 µm.
Figure 7
Figure 7. In situ hybridisation of SLC9A2 transcripts in human colon (A) normal, (B) adenomatous polyp and (C) carcinoma.
Emulsion autoradiographs showing expression of SLC9A2 in epithelium (ep) in bright field and corresponding adjacent dark field images in antisense (left) and sense (right) hybridised tissue sections (n = 5). Bar = 20 µm.

References

    1. Ferlay J, Shin HR, Bray F, Forman D, Mathers C, et al. (2008) v1.2, Cancer Incidence and Mortality Worldwide: IARC CancerBase No. 10 [Internet] Lyon, France: International Agency for Research on Cancer, (2010) Available from: http://globocan.iarc.fr.
    1. Steele RJ, McClements PL, Libby G, Black R, Morton C, et al. (2009) Results from the first three rounds of the Scottish demonstration pilot of FOBT screening for colorectal cancer. Gut 58:530–553. - PubMed
    1. Konishi F, Morson BC (1982) Pathology of colorectal adenomas, a colonoscopic survey. J Clin Pathol 35:830–41. - PMC - PubMed
    1. Hanahan D, Weinberg RA (2000) The Hallmarks of cancer. Cell 100, 57–70. - PubMed
    1. Hanahan D, Weinberg RA (2011) Hallmarks of cancer: the next generation. Cell 144:646–674. - PubMed

Publication types