

Lifespan-extending caloric restriction or mTOR inhibition impair adaptive immunity of old mice by distinct mechanisms
- PMID: 25424641
- PMCID: PMC4326902
- DOI: 10.1111/acel.12280
Lifespan-extending caloric restriction or mTOR inhibition impair adaptive immunity of old mice by distinct mechanisms
Abstract
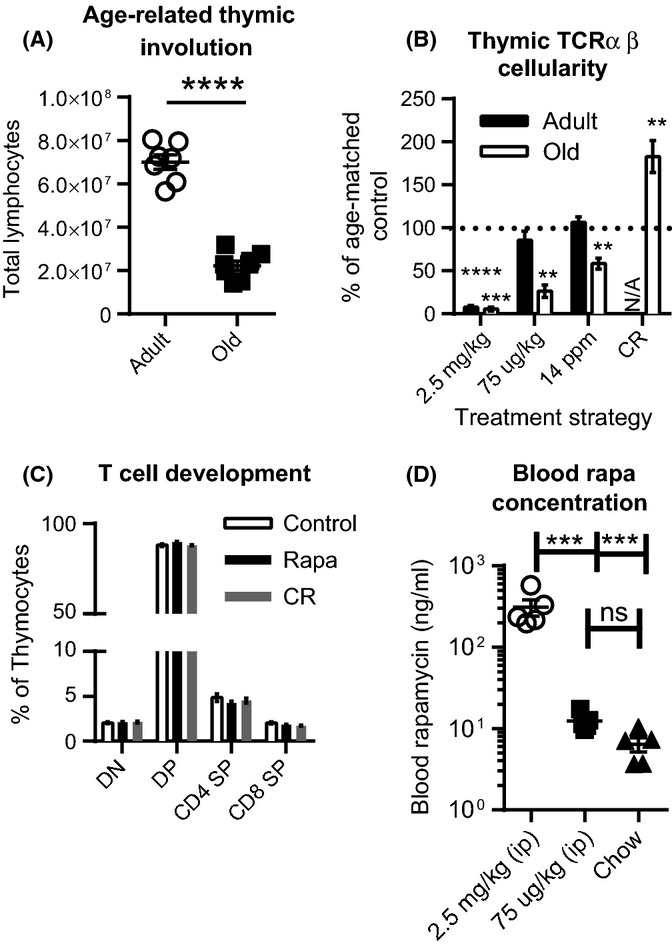
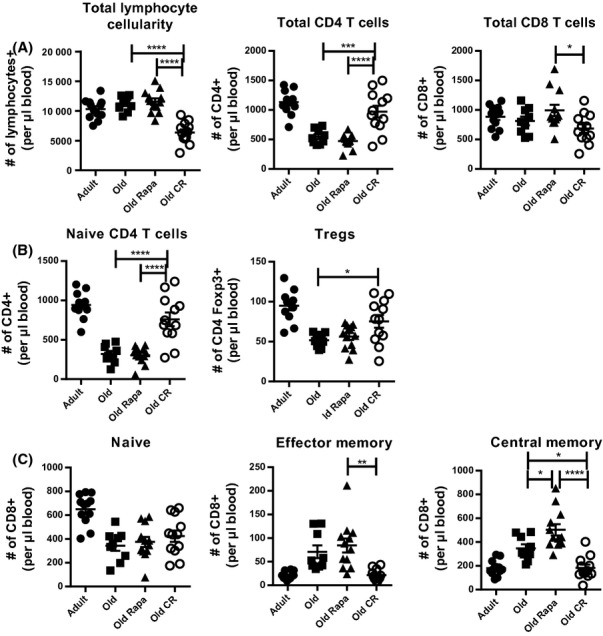
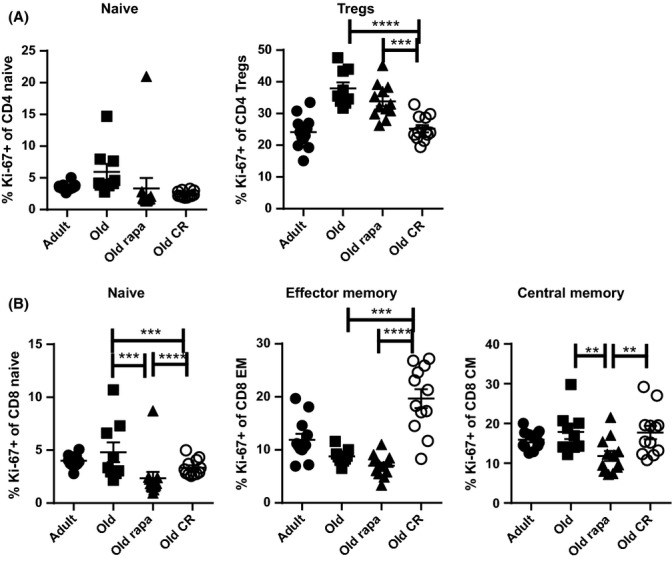
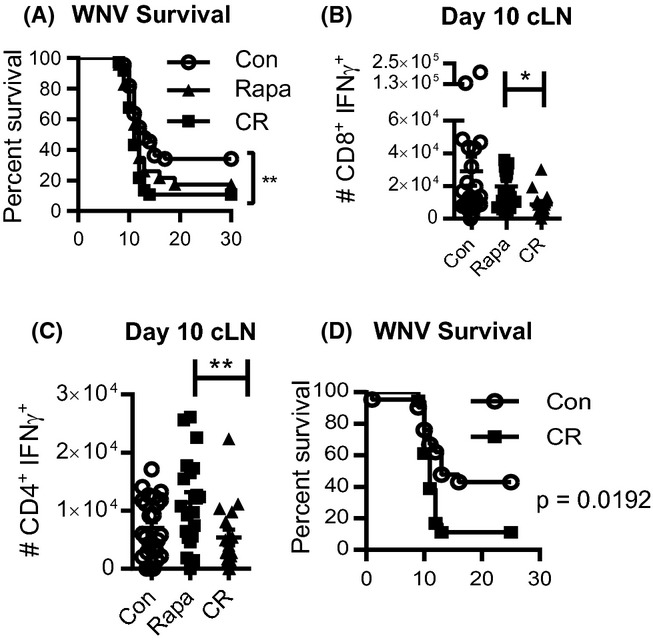
Aging of the world population and a concomitant increase in age-related diseases and disabilities mandates the search for strategies to increase healthspan, the length of time an individual lives healthy and productively. Due to the age-related decline of the immune system, infectious diseases remain among the top 5-10 causes of mortality and morbidity in the elderly, and improving immune function during aging remains an important aspect of healthspan extension. Calorie restriction (CR) and more recently rapamycin (rapa) feeding have both been used to extend lifespan in mice. Preciously few studies have actually investigated the impact of each of these interventions upon in vivo immune defense against relevant microbial challenge in old organisms. We tested how rapa and CR each impacted the immune system in adult and old mice. We report that each intervention differentially altered T-cell development in the thymus, peripheral T-cell maintenance, T-cell function and host survival after West Nile virus infection, inducing distinct but deleterious consequences to the aging immune system. We conclude that neither rapa feeding nor CR, in the current form/administration regimen, may be optimal strategies for extending healthy immune function and, with it, lifespan.
Keywords: T cell; anti-aging; caloric restriction; cellular immunology; longevity regulation; mouse models.
© 2014 The Authors. Aging Cell published by the Anatomical Society and John Wiley & Sons Ltd.
Figures

Similar articles
-
The use of calorie restriction mimetics to study aging.Methods Mol Biol. 2013;1048:95-107. doi: 10.1007/978-1-62703-556-9_8. Methods Mol Biol. 2013. PMID: 23929100
-
Chronic mTOR inhibition in mice with rapamycin alters T, B, myeloid, and innate lymphoid cells and gut flora and prolongs life of immune-deficient mice.Aging Cell. 2015 Dec;14(6):945-56. doi: 10.1111/acel.12380. Epub 2015 Aug 28. Aging Cell. 2015. PMID: 26315673 Free PMC article.
-
Subacute calorie restriction and rapamycin discordantly alter mouse liver proteome homeostasis and reverse aging effects.Aging Cell. 2015 Aug;14(4):547-57. doi: 10.1111/acel.12317. Epub 2015 Mar 23. Aging Cell. 2015. PMID: 25807975 Free PMC article.
-
Koschei the immortal and anti-aging drugs.Cell Death Dis. 2014 Dec 4;5(12):e1552. doi: 10.1038/cddis.2014.520. Cell Death Dis. 2014. PMID: 25476900 Free PMC article. Review.
-
Longevity and skeletal muscle mass: the role of IGF signalling, the sirtuins, dietary restriction and protein intake.Aging Cell. 2015 Aug;14(4):511-23. doi: 10.1111/acel.12342. Epub 2015 Apr 10. Aging Cell. 2015. PMID: 25866088 Free PMC article. Review.
Cited by
-
Considerations for successful cancer immunotherapy in aged hosts.Clin Exp Immunol. 2017 Jan;187(1):53-63. doi: 10.1111/cei.12875. Epub 2016 Nov 7. Clin Exp Immunol. 2017. PMID: 27690272 Free PMC article. Review.
-
Recent Neurotherapeutic Strategies to Promote Healthy Brain Aging: Are we there yet?Aging Dis. 2022 Feb 1;13(1):175-214. doi: 10.14336/AD.2021.0705. eCollection 2022 Feb. Aging Dis. 2022. PMID: 35111369 Free PMC article. Review.
-
Dynamic changes in epithelial cell morphology control thymic organ size during atrophy and regeneration.Nat Commun. 2019 Sep 27;10(1):4402. doi: 10.1038/s41467-019-11879-2. Nat Commun. 2019. PMID: 31562306 Free PMC article.
-
Amino acid starvation enhances vaccine efficacy by augmenting neutralizing antibody production.Sci Signal. 2019 Nov 12;12(607):eaav4717. doi: 10.1126/scisignal.aav4717. Sci Signal. 2019. PMID: 31719173 Free PMC article.
-
Ageing transcriptome meta-analysis reveals similarities and differences between key mammalian tissues.Aging (Albany NY). 2021 Feb 11;13(3):3313-3341. doi: 10.18632/aging.202648. Epub 2021 Feb 11. Aging (Albany NY). 2021. PMID: 33611312 Free PMC article.
References
-
- Blagosklonny MV. Calorie restriction: decelerating mTOR-driven aging from cells to organisms (including humans) Cell Cycle. 2010;9:683–688. - PubMed
-
- Chen J, Astle CM, Harrison DE. Delayed immune aging in diet-restricted B6CBAT6 F1 mice is associated with preservation of naive T cells. J. Gerontol. A Biol. Sci. Med. Sci. 1998;53:B330–B337. ; discussion B338–339. - PubMed
Publication types
MeSH terms
Substances
Grants and funding
LinkOut - more resources
Full Text Sources
Other Literature Sources
Molecular Biology Databases
Miscellaneous
