. 2015 Feb;28(1):133-41.
doi: 10.1007/s10534-014-9809-5. Epub 2014 Nov 26.

Boric acid induces cytoplasmic stress granule formation, eIF2α phosphorylation, and ATF4 in prostate DU-145 cells

Affiliations

Boric acid induces cytoplasmic stress granule formation, eIF2α phosphorylation, and ATF4 in prostate DU-145 cells

Kimberly A Henderson et al. Biometals. 2015 Feb.

Abstract

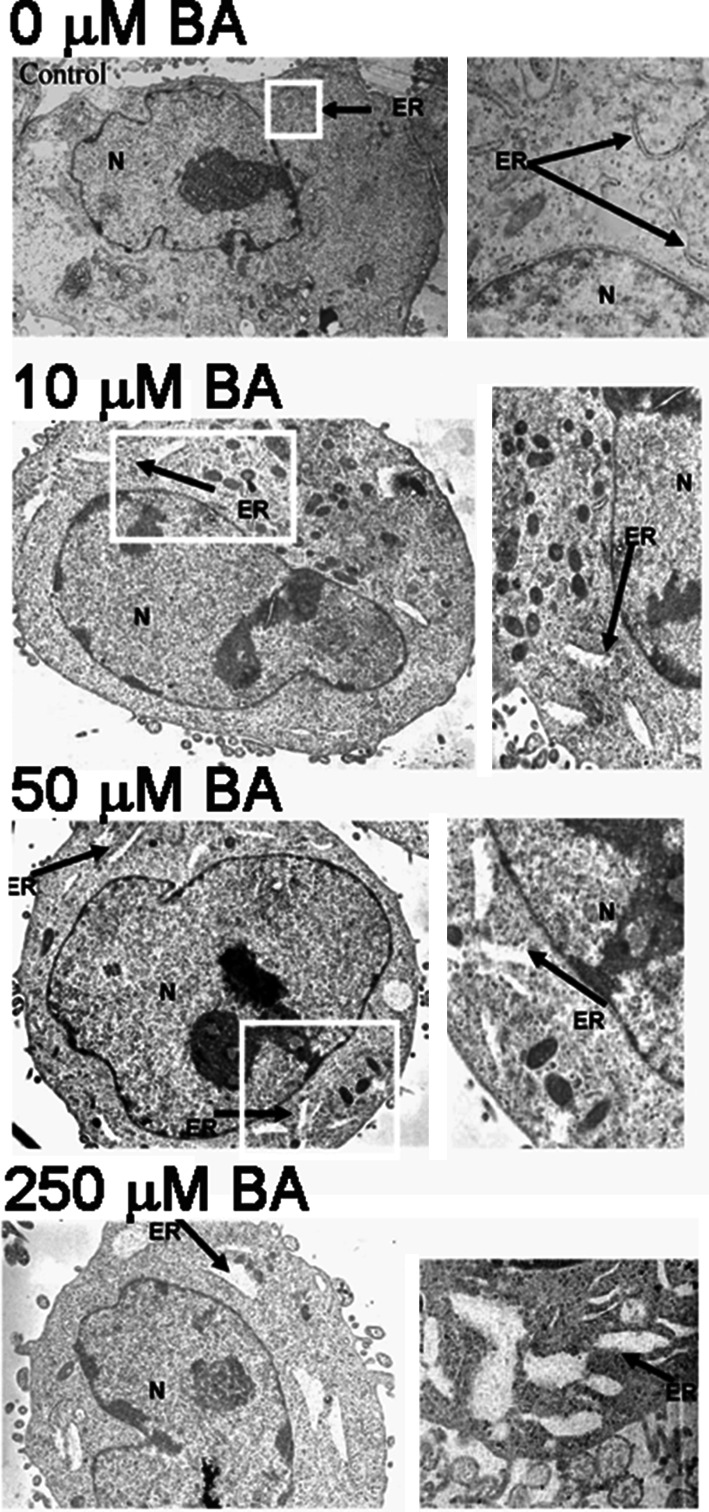
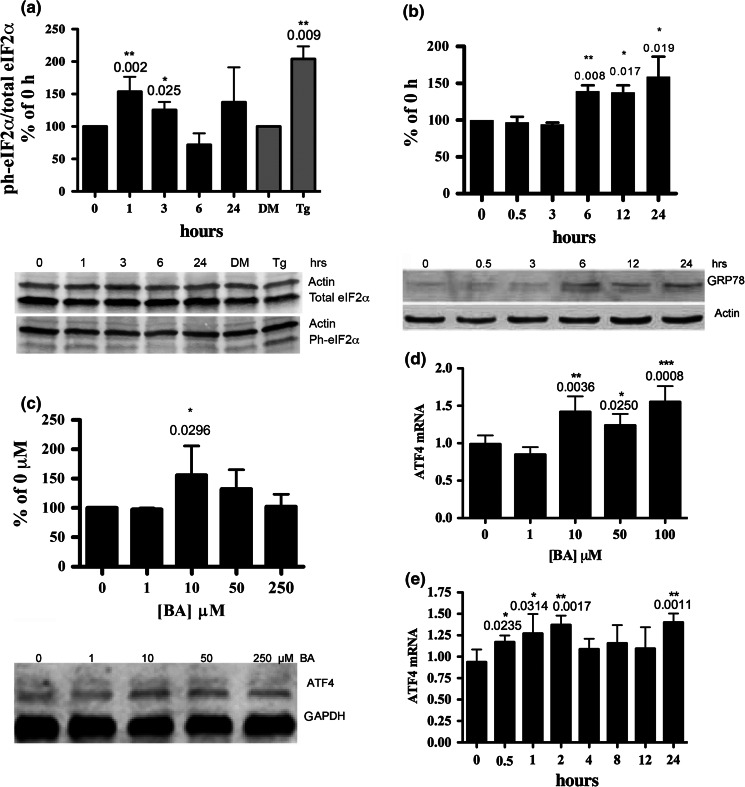
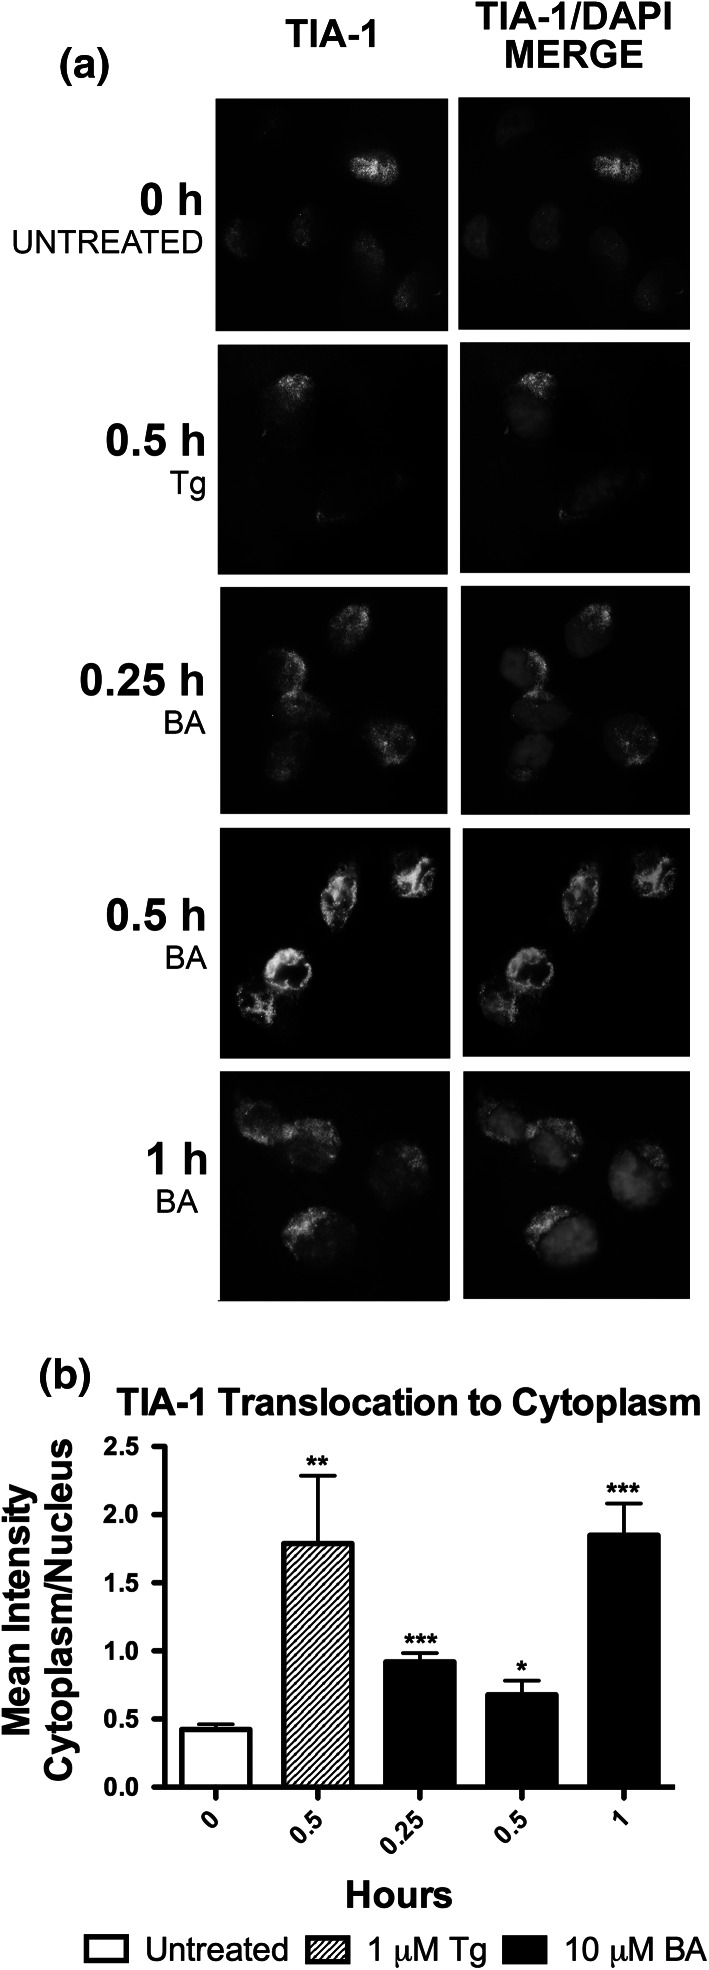
Dietary boron intake is associated with reduced prostate and lung cancer risk and increased bone mass. Boron is absorbed and circulated as boric acid (BA) and at physiological concentrations is a reversible competitive inhibitor of cyclic ADP ribose, the endogenous agonist of the ryanodine receptor calcium (Ca(+2)) channel, and lowers endoplasmic reticulum (ER) [Ca(2+)]. Low ER [Ca(2+)] has been reported to induce ER stress and activate the eIF2α/ATF4 pathway. Here we report that treatment of DU-145 prostate cells with physiological levels of BA induces ER stress with the formation of stress granules and mild activation of eIF2α, GRP78/BiP, and ATF4. Mild activation of eIF2α and its downstream transcription factor, ATF4, enables cells to reconfigure gene expression to manage stress conditions and mild activation of ATF4 is also required for the differentiation of osteoblast cells. Our results using physiological levels of boric acid identify the eIF2α/ATF pathway as a plausible mode of action that underpins the reported health effects of dietary boron.


Figures

Fig. 1
Fig. 1
BA induces ER vacuolization and expansion in DU-145 cells. TEM images of DU-145 cells treated for 24 h with 0, 10, 50, and 250 µM BA (n = 3). Cells exhibited a dose-dependent swelling and vacuolization of the ER, (N nucleus, ER endoplasmic reticulum). White boxes indicate magnified area shown on the right
Fig. 2
Fig. 2
BA induces the eIF2α/ATF4 pathway. a 50 µM BA treated for 24 h induced phosphorylation of eIF2α in DU-145 cells at 1, and 3 h of treatment (n = 3–5). DU-145 cells treated with 1 µM thapsigargin (Tg) or DMSO (DM) for 1 h, n = 3. b DU-145 cells treated with 50 µM BA for 0, 0.5, 3, 6, 12 and 24 h. GAPDH was used as an internal loading control. Translation of GRP78/BiP increased in cells treated at 6–24 h, (n = 3–4). c Treatment of DU-145 cells with 10 µM BA for 24 h caused a significant increase in ATF4. d DU-145 cells were treated with different doses of BA for 24 h and ATF4 mRNA levels measured using real-time PCR (n = 3–6). Significant increases in mRNA were observed at 10, 50 and 100 μM BA. e A time course study following treatment of DU-145 cells with 10 μM BA showed significantly higher ATF4 mRNA levels at 0.5, 1, 2, and 24 h (n = 3–6). Significance differences from 0 concentration or time are shown and represented using *p < 0.05, **p < 0.01 and ***p < 0.001. Error bars represent standard deviations
Fig. 3
Fig. 3
BA induces formation of TIA-1 positive stress granules. 10 µM BA induced formation of TIA-1 positive stress granules in DU-145 cells at 0.25, 0.5, and 1 h, indicated by TIA-1 protein (green) moving out of the nucleus (blue) with BA treatment. 1 µM thapsigargin (Tg) was used as a positive control, (n = 6–24 cells). All time points showed a significant increase. Pictures are representative of results. Significance differences were represented as *p < 0.05, **p < 0.01, and ***p < 0.001 and error bars represent standard deviations. (Color figure online)
Fig. 4
Fig. 4
The cell cycle was not significantly altered by BA treatment. Flow cytometry analysis was conducted a 24 h treatment with 0 or 50 µM BA. The percent of cells treated with 0 or 50 µM BA were: G1 phase 50.59 ± 0.75 and 51.21 ± 0.62 %, S phase 13.09 ± 1.16 and 15.15 ± 0.38 %, G2 phase 32.09 ± 0.46 and 31.53 ± 0.18 % respectively, (n = 3). The 2 % shift in S phase was of doubtful biological significance. Standard deviation error bars were plotted, but are too close to the bar graph to visualize

References

    1. Anderson P, Kedersha N. Stressful initiations. J Cell Sci. 2002;115:3227–3234. - PubMed
    1. Armstrong TA, Spears JW. Effect of boron supplementation of pig diets on the production of tumor necrosis factor-a and interferon-g. J Anim Sci. 2003;81:2552–2561. - PubMed
    1. Barranco WT, Eckhert CD. Boric acid inhibits prostate cancer cell proliferation. Cancer Lett. 2004;216:21–29. doi: 10.1016/j.canlet.2004.06.001. - DOI - PubMed
    1. Barranco W, Eckhert C. Cellular changes in boric acid-treated DU-145 prostate cancer cells. Br J Cancer. 2006;94:884–890. doi: 10.1038/sj.bjc.6603009. - DOI - PMC - PubMed
    1. Barranco W, Hudak P, Eckhert C. Evaluation of ecological and in vitro effects of boron on prostate cancer risk. Cancer Causes Control. 2007;18:71–77. doi: 10.1007/s10552-006-0077-8. - DOI - PubMed

Publication types

MeSH terms