. 2015 Feb;24(2):133-9.
doi: 10.1111/exd.12603. Epub 2015 Jan 12.

CpGB DNA activates dermal macrophages and specifically recruits inflammatory monocytes into the skin

Affiliations

CpGB DNA activates dermal macrophages and specifically recruits inflammatory monocytes into the skin

Allison L Mathes et al. Exp Dermatol. 2015 Feb.

Abstract

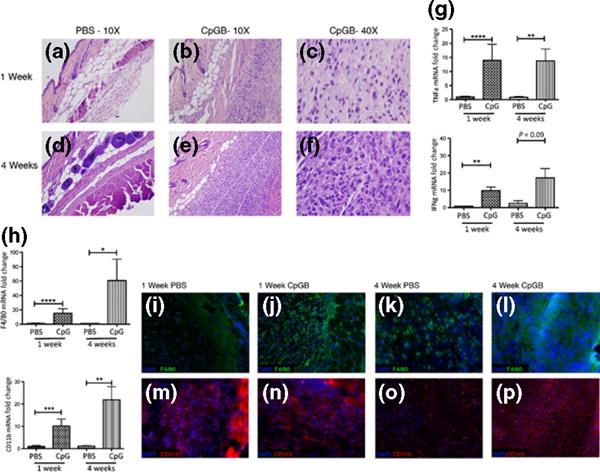
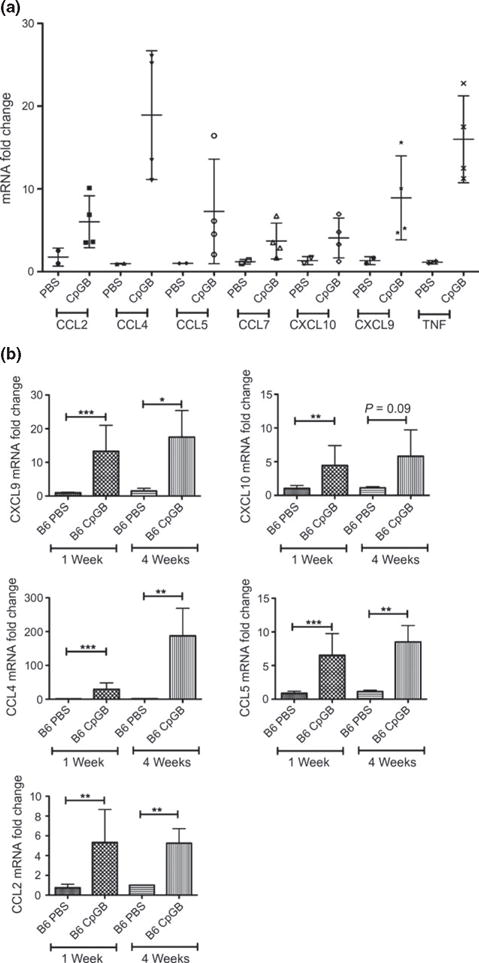
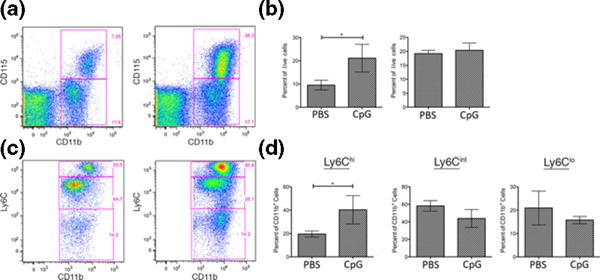
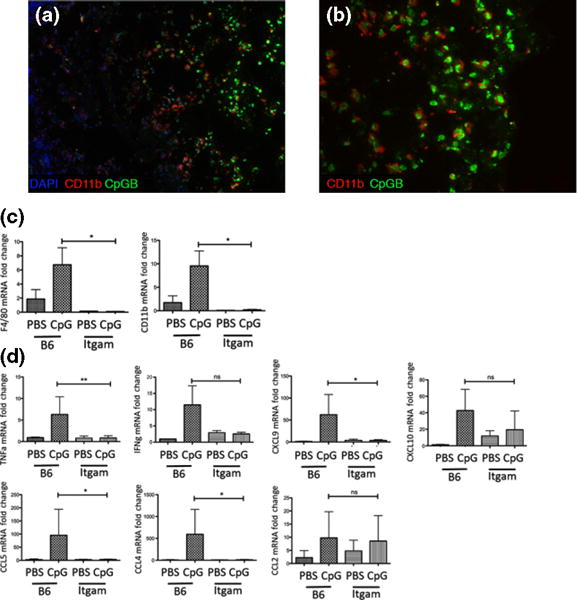
Toll-like receptor 9 (TLR9) drives innate immune responses after recognition of foreign or endogenous DNA containing unmethylated CpG motifs. DNA-mediated TLR9 activation is highly implicated in the pathogenesis of several autoimmune skin diseases, yet its contribution to the inflammation seen in these diseases remains unclear. In this study, TLR9 ligand, CpGB DNA, was administered to mice via a subcutaneous osmotic pump with treatment lasting 1 or 4 weeks. Gene expression and immunofluorescence analyses were used to determine chemokine expression and cell recruitment in the skin surrounding the pump outlet. CpGB DNA skin treatment dramatically induced a marked influx of CD11b+ F4/80+ macrophages, increasing over 4 weeks of treatment, and induction of IFNγ and TNFα expression. Chemokines, CCL2, CCL4, CCL5, CXCL9 and CXCL10, were highly induced in CpGB DNA-treated skin, although abrogation of these signalling pathways individually did not alter macrophage accumulation. Flow cytometry analysis showed that TLR9 activation in the skin increased circulating CD11b+ CD115+ Ly6C(hi) inflammatory monocytes following 1 week of CpGB DNA treatment. Additionally, skin-resident CD11b+ cells were found to initially take up subcutaneous CpGB DNA and propagate the subsequent immune response. Using diphtheria toxin-induced monocyte depletion mouse model, gene expression analysis demonstrated that CD11b+ cells are responsible for the CpGB DNA-induced cytokine and chemokine response. Overall, these data demonstrate that chronic TLR9 activation induces a specific inflammatory response, ultimately leading to a striking and selective accumulation of macrophages in the skin.

Keywords: cell trafficking; chemokines; inflammation; monocytes/macrophages; skin.


Conflict of interest statement

Conflict of interests

The authors have declared no conflicting interests.

Figures

Figure 1
Figure 1
Chronic CpGB DNA skin treatment induces severe inflammation and an influx of CD11b+ F4/80+ cells. Haematoxylin and eosin staining of skin sections taken from mice treated with PBS or CpGB DNA for 1 or 4 weeks. (a) PBS 1 week treatment (b, c) CpGB DNA 1 week treatment (d) PBS 4 week treatment (e, f) CpGB DNA 4 week treatment (a, b, d, e) Images taken at 10× magnification. (c, f) Image taken at 40× magnification. (g) Gene expression analysis for TNFα and IFNγ. All genes are normalized to GAPDH and compared to the respective PBS-treated mouse. PBS 1 week: n = 8; CpGB 1 week: n = 11; PBS 4 week: n = 3; CpGB 4 week: n = 5. Data collected from five experiments. **P < 0.01; ****P < 0.0001. (h) Gene expression analysis for macrophage markers, F4/80 and CD11b. All genes are normalized to GAPDH and compared to the respective PBS-treated mouse. PBS 1 week: n = 8; CpGB 1 week: n = 11; PBS 4 week: n = 3; CpGB 4 week: n = 5. *P < 0.05; **P < 0.01; ***P < 0.001; ****P < 0.0001. (i–p) Immunofluorescence staining of skin treated with PBS or CpGB for 1 or 4 weeks; (i–l) F4/80 antibody conjugated to FITC; (m–p) CD11b antibody conjugated to PE; (i, m) PBS 1 week treatment; (j, n) 1 week CpGB DNA treatment; (k, o) 4 week PBS treatment; (l, p) 4 week CpGB DNA treatment. All images are taken at 20× magnification. Data collected from five experiments.
Figure 2
Figure 2
Chronic CpGB DNA skin treatment induces a specific chemokine response. (a) Chemokine gene expression array analysis. Only genes with an average fold change in CpGB DNA-treated skin greater than threefold compared to PBS-treated skin are shown. PBS: n = 2; CpGB: n = 4. Data collected from two experiments. (b) Gene expression analysis on the six induced chemokines identified in the array: CXCL9, CXCL10, CCL2, CCL4, CCL5, CCL7. PBS 1 week: n = 4; CpGB 1 week: n = 5; PBS 4 week: n = 3; CpGB 4 week: n = 5. Data collected from five experiments. For all genes, expression is normalized to housekeeping gene (a: HSP90 and b: GAPDH) and compared to the respective PBS-treated mouse. *P < 0.05; **P < 0.01; ***P < 0.001.
Figure 3
Figure 3
Inflammatory monocytes are increased in the blood following CpGB DNA skin treatment. Flow cytometry analysis of peripheral blood mononuclear cells from 1 week PBS or CpGB DNA-treated mice, using CD11b-APC_Cy7, CD115-PE, Ly6C-Pacific Blue, and AmCyan Live/Dead cell staining. Data shown is gated on live cells. Representative images are shown in dot plots. (a) CD11b and CD115 staining, showing selection of CD11b+ CD115+ cells (monocytes) and CD11b+ CD115 cells (neutrophils) (b) Gating on CD11b+ cells, Ly6C staining, showing selection of Ly6Chi cells (inflammatory monocytes), Ly6Cint cells (neutrophils), and Ly6C cells (patrolling monocytes). (c, d) Quantification of per cent positive cells for each population, n = 3. Data collected from one experiment. *P < 0.05.
Figure 4
Figure 4
CpGB DNA-induced skin inflammation is dependent on dermal CD11b+ cells. Immunofluorescence staining for CD11b in B6 skin 4 h following subcutaneous injection with CpGB-FITC (Subpanels a, b). CpGB-FITC – green; CD11b-PE – red; Nuclei-DAPI – blue. (a) 10× magnification (b) 20× magnification. Representative image from two experiments. Gene expression analysis from diphtheria toxin depletion model CD11b-DTR (Subpanels c, d) (c) Gene expression analysis of macrophage markers: CD11b and F4/80. (d) Gene expression analysis of cytokines: TNFα and IFNγ and chemokines: CCL2, CCL4, CCL5, CXCL9 and CXCL10. For all treated mice, PBS n = 4; CpGB n = 6. Data collected from two experiments. Gene expression is normalized GAPDH and compared to the respective PBS-treated mouse. *P < 0.05; **P < 0.01.

References

    1. Hemmi H, Takeuchi O, Kawai T, et al. Nature. 2000;408:740–745. - PubMed
    1. Lin JH, Dutz JP, Sontheimer RD, et al. Clin Rev Allergy Immunol. 2007;33:85–106. - PubMed
    1. Nestle FO, Di Meglio P, Qin JZ, et al. Nat Rev Immunol. 2009;9:679–691. - PMC - PubMed
    1. Marshak-Rothstein A, Rifkin IR. Annu Rev Immunol. 2007;25:419–441. - PubMed
    1. Rifkin IR, Leadbetter EA, Busconi L, et al. Immunol Rev. 2005;204:27–42. - PubMed

Publication types

MeSH terms