. 2015 Jan 9;290(2):889-903.
doi: 10.1074/jbc.M114.618140. Epub 2014 Nov 25.

Variomics screen identifies the re-entrant loop of the calcium-activated chloride channel ANO1 that facilitates channel activation

Affiliations

Variomics screen identifies the re-entrant loop of the calcium-activated chloride channel ANO1 that facilitates channel activation

Anke Bill et al. J Biol Chem. .

Abstract

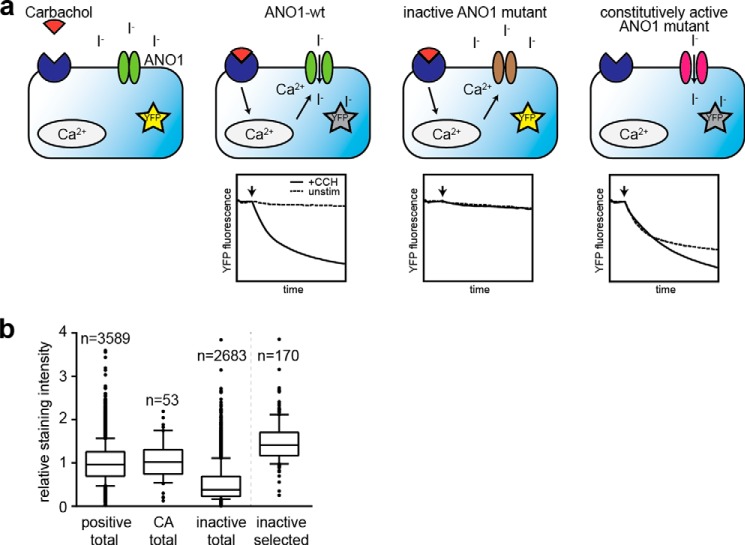
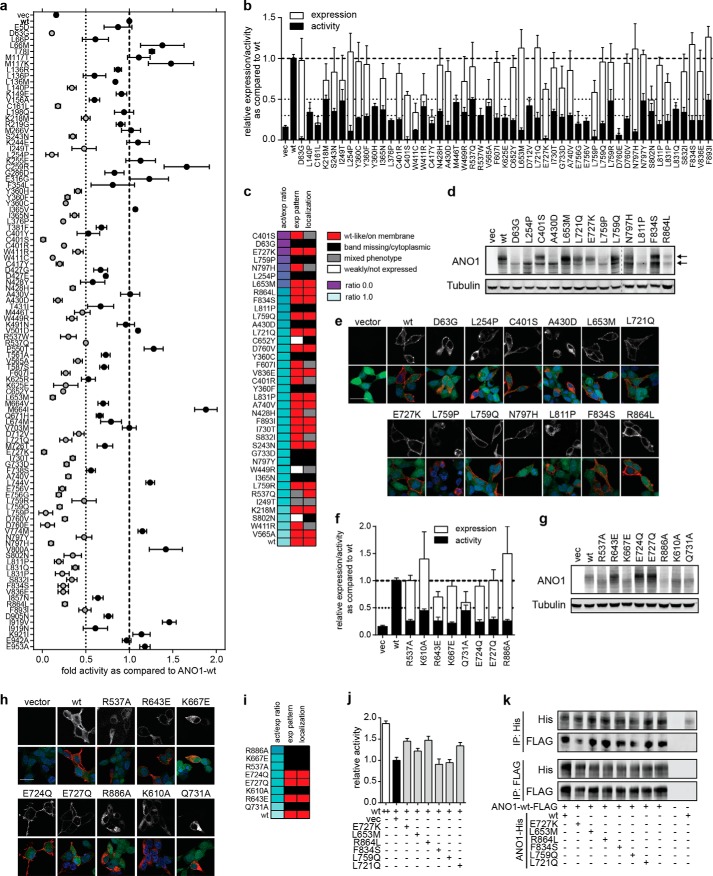
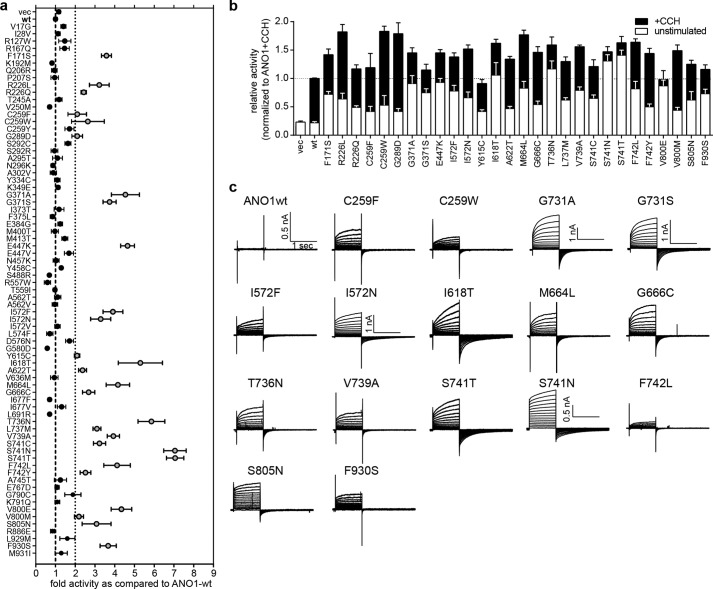
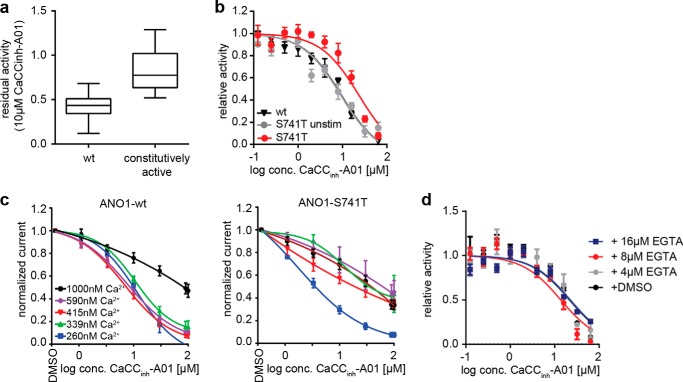
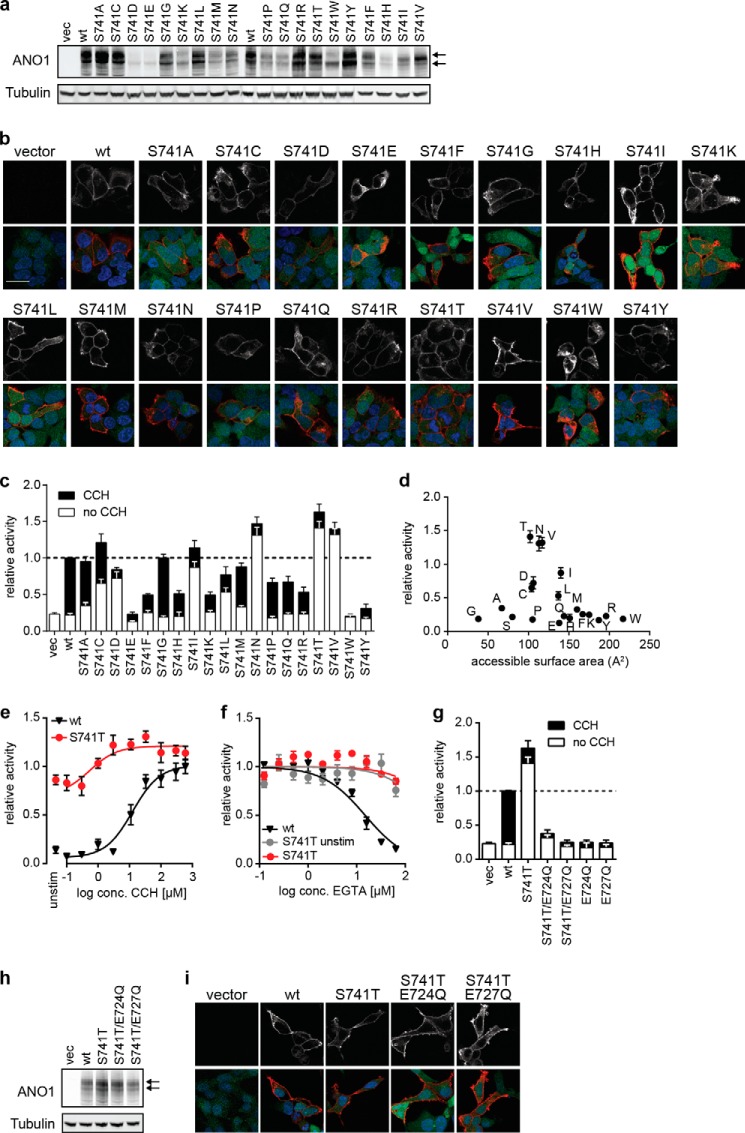
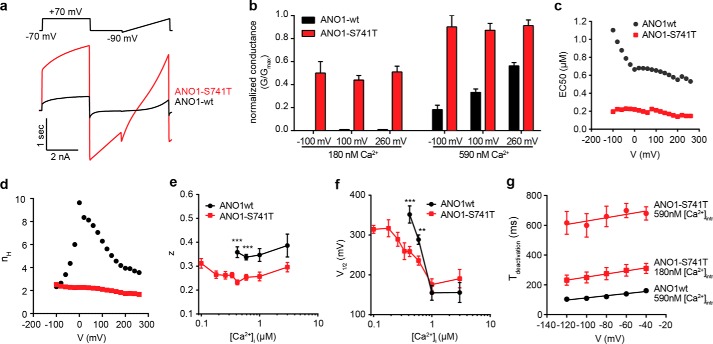
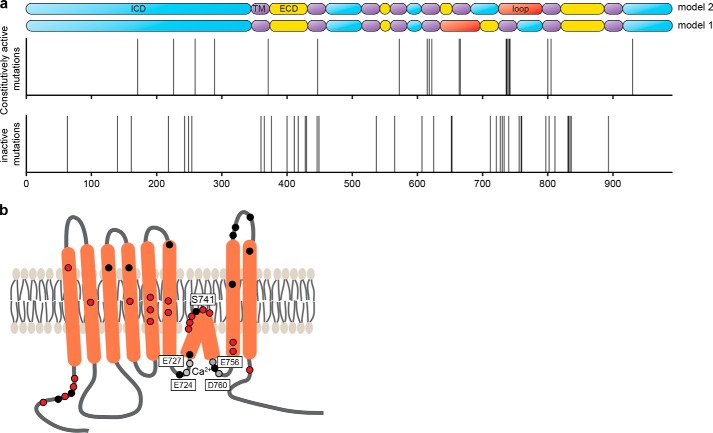
The calcium-activated chloride channel ANO1 regulates multiple physiological processes. However, little is known about the mechanism of channel gating and regulation of ANO1 activity. Using a high-throughput, random mutagenesis-based variomics screen, we generated and functionally characterized ∼6000 ANO1 mutants and identified novel mutations that affected channel activity, intracellular trafficking, or localization of ANO1. Mutations such as S741T increased ANO1 calcium sensitivity and rendered ANO1 calcium gating voltage-independent, demonstrating a critical role of the re-entrant loop in coupling calcium and voltage sensitivity of ANO1 and hence in regulating ANO1 activation. Our data present the first unbiased and comprehensive study of the structure-function relationship of ANO1. The novel ANO1 mutants reported have diverse functional characteristics, providing new tools to study ANO1 function in biological systems, paving the path for a better understanding of the function of ANO1 and its role in health and diseases.

Keywords: ANO1; Chloride Channel; Ion Channel; Mutagenesis; Protein Structure; Site-directed Mutagenesis; TMEM16A; Variomics.


Figures

FIGURE 1.
FIGURE 1.
Functional characterization of a library of ∼6000 ANO1 mutants. a, schematic summary of the principle of the YFP-quench assay. HEK293 cells stably expressing a halide-sensitive variant of YFP (YFP H148Q/I152L) were transiently transfected with ANO1, and the ANO1-mediated influx of iodide was analyzed by measuring YFP fluorescence before and after stimulation of intracellular calcium release with CCH. Exemplary measurements are shown. b, relative staining intensity of ANO1 (normalized to the mean staining intensity of the active ANO1 mutants) in the three experimental groups (positive, wild-type like activity; CA, constitutive activity; inactive, no activity) and the subset of inactive mutants selected for further characterization in subsequent experiments. Each box represents the median and 25th/75th percentiles; whiskers depict the minimum and maximum.
FIGURE 2.
FIGURE 2.
Characterization of inactive ANO1 mutants. a, activity of selected single amino mutants of ANO1 measured in a YFP-quench assay after stimulation with CCH. Data were normalized to the activity of ANO1-wild type (wt) mean ± S.E. n ≥ 4. b, comparison of the activity (as determined in a) and expression level (measured by high-content imaging) of 52 inactive ANO1 mutants. Data were normalized to the respective signal of ANO1-WT (mean ± S.E., n ≥ 4). c, summary of the characterization of inactive mutants. The activity/expression ratio was calculated by dividing the relative activity with the relative expression level. The expression pattern was analyzed by Western blotting and the localization by high-content imaging. d, Western blot analysis of selected inactive ANO1 mutants (act/expression ratio <0.25). Arrows indicate the two distinct bands detected for ANO1. Tubulin served as a loading control. Representative images are shown. Image has been cropped at indicated position (dashed line). e, immunofluorescence analysis of ANO1 expression and localization (anti-His, red) in HEK293-YFP cells (YFP expression, green), nuclear stain (DAPI, blue). Representative confocal images are shown. The upper panel depicts the signal for ANO1 in gray scale. Scale bar, 20 μm. f, comparison of the activity (YFP-quench assay) and expression level (high-content imaging) of previously described inactive ANO1 mutants. Data were normalized to the respective signal of ANO1-WT and are presented as the mean ± S.E. of ≥4 experiments. g, Western blot analysis of inactive ANO1 mutants previously described in the literature. vec, vector. h, immunofluorescence analysis of ANO1 expression and localization of previously described inactive ANO1 mutants as described in e. i, summary of the characterization of inactive mutants previously reported in the literature. j, activity of ANO1-WT in the YFP-quench assay when coexpressed with equal amounts of vector, wild type, or the indicated inactive mutants. Data were normalized to the activity of ANO1-WT cotransfected with equal amounts of empty vector and are presented as the mean ± S.E. of ≥8 measurements. k, coimmunoprecipitation (IP) analysis of the hetero-oligomerization of ANO1-WT and inactive mutants of ANO1. HEK293-YFP cells were transfected with equal amounts of the indicated mutants (His-tagged) and ANO1-WT (FLAG-tagged), and ANO1 was precipitated from the lysate using Ni-NTA or anti-FLAG antibody-coated beads, and the amount of copurified ANO1-WT or inactive mutant, respectively, was determined by Western blotting.
FIGURE 3.
FIGURE 3.
Characterization of constitutively active ANO1 mutants. a, activity of selected single amino mutants of ANO1 measured in an YFP-quench assay in the absence of CCH (unstimulated). Data were normalized to the activity of ANO1-WT (mean ± S.E., n ≥ 4). b, comparison of the activity (YFP-quench assay) of 28 constitutively active ANO1 mutants in the absence (unstimulated) and presence of CCH (+CCH). Data were normalized to the respective signal of ANO1-WT (mean ± S.E., n ≥ 4). c, whole-cell voltage clamp recordings of ANO1-mediated chloride currents of the indicated mutants at 180 nm free intracellular calcium. Voltage steps of 1-s duration were given from a holding potential of −70 mV to voltages between −70 and +70 mV in 10-mV increments, followed by a step to −70 mV. If not otherwise indicated, the scale shown for ANO1-wt applies for all panels.
FIGURE 4.
FIGURE 4.
CaCCinh-A01 sensitivity of ANO1 mutants. a, residual activity of all 28 constitutively active single amino mutants of ANO1 as compared with WT after treatment with 10 μm CaCCinh-A01 measured in a YFP-quench assay in the presence of CCH. Data were normalized to the activity of the DMSO-treated ANO1-WT (wt). Each box represents the median and 25th/75th percentiles of ≥4 measurements; whiskers depict the minimum and maximum. b, activity of ANO1-WT and ANO1-S741T in the YFP-quench assay after treatment with the indicated concentrations of CaCCinh-A01. Data present mean ± S.E. of ≥3 measurements. c, CaCCinh-A01 concentration-dependent inhibition of ANO1 currents at the indicated range of calcium concentrations, determined by whole-cell voltage clamp recordings (+70 mV). Data were normalized to basal currents in the absence of inhibitor (mean ± S.E. of ≥3). d, activity of ANO1-S741T in the YFP-quench assay after treatment with the indicated concentrations of CaCCinh-A01 and EGTA-AM or DMSO. Data present mean ± S.E. of ≥3 measurements.
FIGURE 5.
FIGURE 5.
Mutation of ANO1-Ser-741 to Thr facilitates activation of ANO1. a, Western blot analysis Ser-741-ANO1 mutants. The arrows indicate the two distinct bands detected for ANO1. Tubulin served as a loading control. Representative images are shown. b, immunofluorescence analysis of Ser-741-ANO1 mutant expression and localization (anti-His, red) in HEK293-YFP cells (YFP expression, green), nuclear stain (DAPI, blue). Representative confocal images are shown. The upper panel depicts the signal for ANO1 in gray scale. Scale bar, 20 μm. c, comparison of the activity (YFP-quench assay) of ANO1 mutants with alternative amino acid changes at Ser-741 in the absence (unstimulated) and presence of CCH (+CCH). Data were normalized to the respective signal of ANO1-WT (mean ± S.E., n ≥ 4). vec, vector. d, relative activity of each Ser-741 mutant is plotted as a function of side chain surface area. Letters indicate the substituted amino acid. e, comparison of the activity of ANO1-WT and ANO1-S741T at different concentrations of CCH (YFP-quench assay). Data were normalized to the maximal activity of ANO1-WT (mean ± S.E., n ≥ 4). f, sensitivity of ANO1-WT and ANO1-S741T to inhibition with EGTA. Activity of ANO1-WT/-S741T in the YFP-quench assay was measured after treatment with the indicated concentrations of EGTA-AM in the presence or absence of CCH. Data were normalized to the activity after treatment with DMSO and are presented as the mean ± S.E. of ≥4 experiments. g, relative activity of indicated double mutant of ANO1-S741T in the YFP-quench assay as compared with ANO1-S741T and ANO1-WT. h, Western blot analysis of ANO1-S741T mutants. The arrows indicate the two distinct bands detected for ANO1. Tubulin served as a loading control. Representative images are shown. i, immunofluorescence analysis of ANO1-S741T mutants as described in b.
FIGURE 6.
FIGURE 6.
Electrophysiological characterization of ANO1-S741T. a, representative whole-cell current traces recorded for ANO1-WT and ANO1-S741T at 415 nm intracellular free calcium. Voltage protocol as shown in the figure. b, normalized conductance (G/Gmax) of ANO1-WT and ANO1-S741T. G has been normalized to the individual maximal conductances at the specified voltage. c, EC50 value of the calcium-dependent activation of ANO1-WT and ANO1-S741T at the indicated membrane potentials. EC50 values were obtained from fitting of the mean [Ca2+]i − whole-cell conductance response relationship with the Hill-Langmuir equation. The mean conductance at a given potential and [Ca2+]i was obtained by averaging conductances measured in n = 4–50 and n = 4–64 cells for ANO1-WT and ANO1-S741T, respectively. d, Hill coefficient across a range of membrane potentials from the same fit as described in a. e, plot of the estimated membrane potential producing half-maximal activation (V½) of ANO1-WT/S741T versus the concentration of intracellular free calcium. V½ was obtained from fitting a Boltzmann equation to the voltage dependence of normalized whole-cell conductance at a given [Ca2+]i. The maximum conductance Gmax was estimated from the fit of the voltage dependence of G at 1 μm free [Ca2+]i, and G at each [Ca2+]i was then normalized to the same Gmax. n = 9–45. f, plot of the estimated gating charge (z) associated with voltage-dependent channel opening of ANO1-WT/S741T versus the concentration of intracellular free calcium. Fitting of data as described in e. g, kinetic analysis of the deactivation time of ANO1-WT/S741T. Tail currents were fitted to single exponentials, and the time constants were plotted versus membrane potential. n = 5–15. **, p < 0.01; ***, p < 0.001.
FIGURE 7.
FIGURE 7.
Functional map of ANO1. a, pictogram showing the localization of all identified inactive (lower panel) and constitutively active (middle panel) mutants of ANO1 (x axis, amino acid position of ANO1). Each line represents the position of a mutant. The upper panel depicts the predicted topologies for ANO1 (model 1 is based on Refs. , and model 2 is based on Ref. 23). Blue, intracellular domain; purple, transmembrane domain; yellow, extracellular domain; red, loop region with proposed re-entrant loop. b, schematic illustrating the predicted topology of ANO1-abc (23, 24). The proposed calcium-binding sites of ANO1 are indicated by gray dots, and the location of the newly identified constitutively active mutants and inactive mutants with membrane localization are highlighted with red and black dots, respectively.

References

    1. Caputo A., Caci E., Ferrera L., Pedemonte N., Barsanti C., Sondo E., Pfeffer U., Ravazzolo R., Zegarra-Moran O., Galietta L. J. (2008) TMEM16A, a membrane protein associated with calcium-dependent chloride channel activity. Science 322, 590–594 - PubMed
    1. Duran C., Thompson C. H., Xiao Q., Hartzell H. C. (2010) Chloride channels: often enigmatic, rarely predictable. Annu. Rev. Physiol. 72, 95–121 - PMC - PubMed
    1. Schroeder B. C., Cheng T., Jan Y. N., Jan L. Y. (2008) Expression cloning of TMEM16A as a calcium-activated chloride channel subunit. Cell 134, 1019–1029 - PMC - PubMed
    1. Yang Y. D., Cho H., Koo J. Y., Tak M. H., Cho Y., Shim W. S., Park S. P., Lee J., Lee B., Kim B. M., Raouf R., Shin Y. K., Oh U. (2008) TMEM16A confers receptor-activated calcium-dependent chloride conductance. Nature 455, 1210–1215 - PubMed
    1. Gomez-Pinilla P. J., Gibbons S. J., Bardsley M. R., Lorincz A., Pozo M. J., Pasricha P. J., Van de Rijn M., West R. B., Sarr M. G., Kendrick M. L., Cima R. R., Dozois E. J., Larson D. W., Ordog T., Farrugia G. (2009) Ano1 is a selective marker of interstitial cells of Cajal in the human and mouse gastrointestinal tract. Am. J. Physiol. Gastrointest. Liver Physiol. 296, G1370–G1381 - PMC - PubMed

LinkOut - more resources