. 2014 Dec 16;111(50):17947-52.
doi: 10.1073/pnas.1420822111. Epub 2014 Nov 25.

Dissecting the clonal origins of childhood acute lymphoblastic leukemia by single-cell genomics

Affiliations

Dissecting the clonal origins of childhood acute lymphoblastic leukemia by single-cell genomics

Charles Gawad et al. Proc Natl Acad Sci U S A. .

Abstract

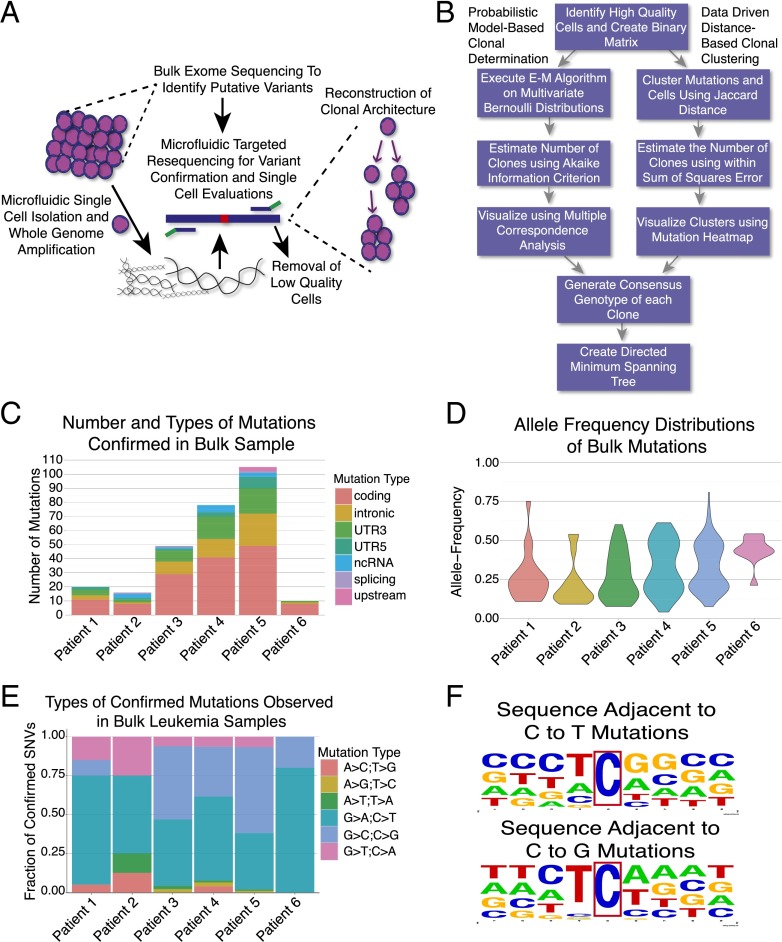
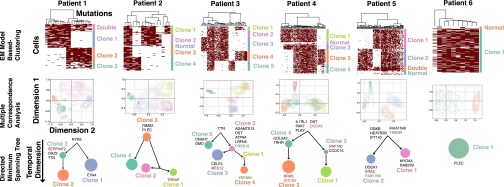
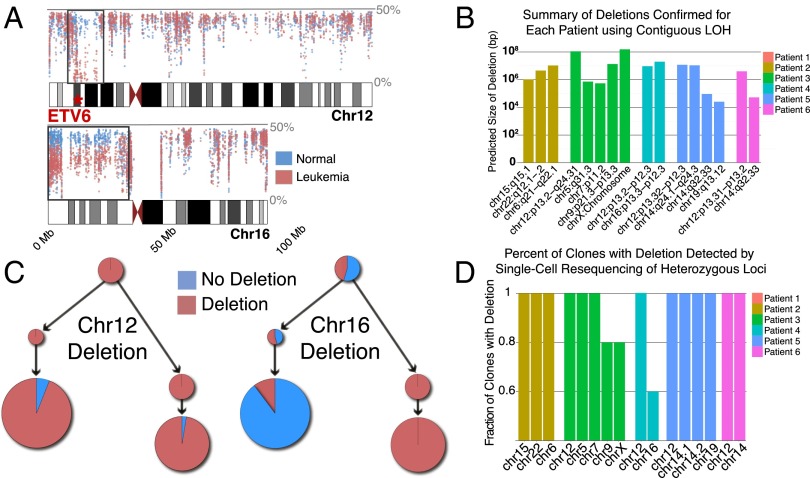
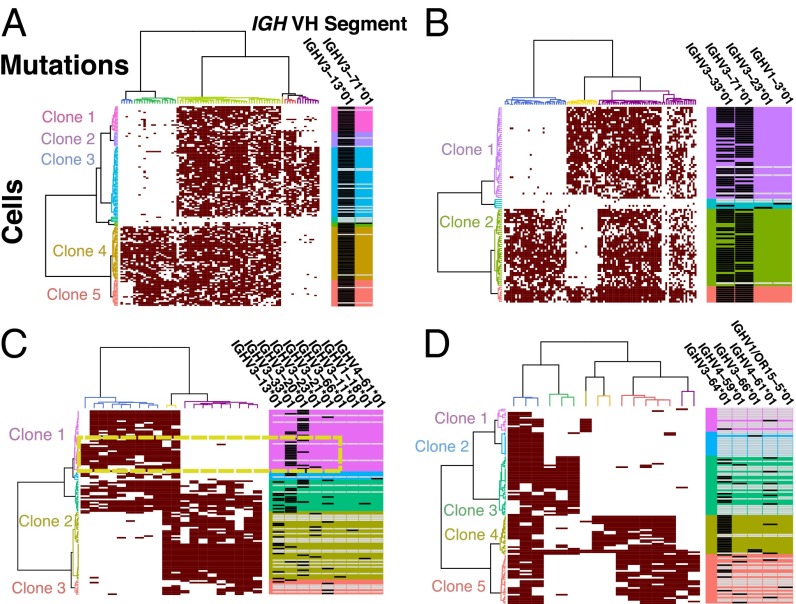
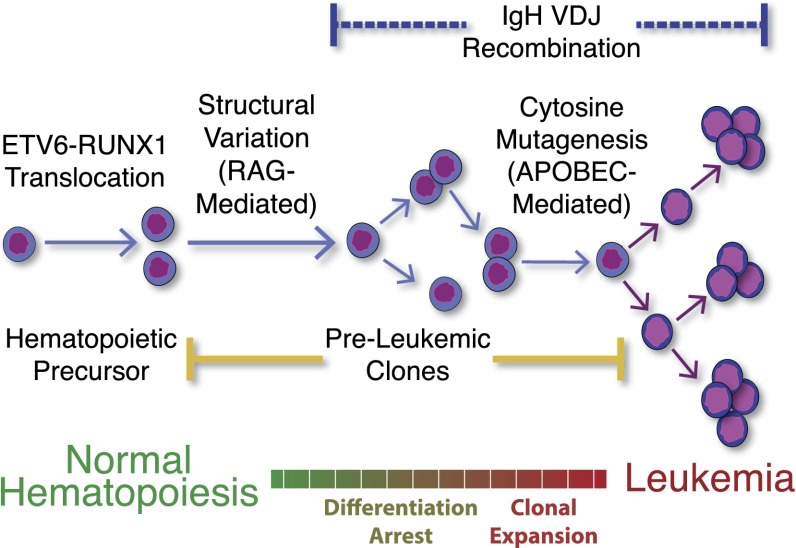
Many cancers have substantial genomic heterogeneity within a given tumor, and to fully understand that diversity requires the ability to perform single cell analysis. We performed targeted sequencing of a panel of single nucleotide variants (SNVs), deletions, and IgH sequences in 1,479 single tumor cells from six acute lymphoblastic leukemia (ALL) patients. By accurately segregating groups of cooccurring mutations into distinct clonal populations, we identified codominant clones in the majority of patients. Evaluation of intraclonal mutation patterns identified clone-specific punctuated cytosine mutagenesis events, showed that most structural variants are acquired before SNVs, determined that KRAS mutations occur late in disease development but are not sufficient for clonal dominance, and identified clones within the same patient that are arrested at varied stages in B-cell development. Taken together, these data order the sequence of genetic events that underlie childhood ALL and provide a framework for understanding the development of the disease at single-cell resolution.

Keywords: acute lymphoblastic leukemia; clonal evolution; cytosine mutagenesis; intratumor heterogeneity; single-cell genomics.


Conflict of interest statement

Conflict of interest statement: S.R.Q. is a founder of and consultant for Fluidigm.

Figures

Fig. 1.
Fig. 1.
Overview of approach and bulk exome sequencing data. (A) Overview of experimental approach where bulk sequencing is used to identify mutations, followed by single-cell interrogations of those loci to reconstruct tumor phylogenies. (B) Overview of computational methods to use the single-cell mutation profiles to determine clonal structures (E–M, expectation maximization). (C) Number and classes of bulk mutations acquired in each patient. (D) Mutation allele frequency distributions for all confirmed bulk mutations. (E) Types of base changes observed in leukemia samples. (F) Evaluation of neighboring bases of C->T and C->G mutations reveal a strong preference for T preceding C.
Fig. 2.
Fig. 2.
Clone structures determined using expectation maximization algorithm on the multivariate Bernouli distribution model. Cells were visualized on the y-axes and mutations clustered by Jaccard distance on the x-axes. Mutation calls are represented by maroon boxes. The identification of statistically significant groups of cells by the expectation maximization on the multivariate Bernouli distribution model is visualized using multiple correspondence analysis. Interclonal distances and undetectable ancestors are quantitated and visualized using a directed minimum spanning trees. The size of each clone is proportional to its relative abundance, and the length of edges is proportional to the Jaccard distance between clones. Recurrently mutated genes in ETV-RUNX1 leukemias are shown in the clones where they were acquired; green genes are mutated more than once in the same clone, whereas orange genes are mutated more than once in the same patient, but in different clones. Genes that have been colored red have been implicated in ALL by the Cancer Genome Census, suggesting they could be providing increased fitness to those clones (22).
Fig. 3.
Fig. 3.
Overview of deletions detected in bulk exome and single cell data. (A) View of allele frequency of less abundant allele across chromosomes 12 and 16 in patient 4. Regions with a contiguous decrease in the allele frequency in the leukemia compared with the germ line represent deletions (black boxes). The allele frequency for the deletion in chromosome 12 (which includes ETV6) approaches 0%, suggesting it is clonal. Chromosome 16 deletion is near 25%, suggesting it is subclonal. (B) Number and size of deletions detected across all six patients using this approach. (C) Segregation of deletions across clones in patient 4. Chromosome 12 deletion is present in all clones, as predicted in A. Chromosome 16 deletion segregated down one branch of the tree, with a much lower level of deletion detection in other clones due to ADO leading to false calls. (D) Most deletions are detected in all clones, suggesting that the process that produces the deletions occurs before mutations are acquired.
Fig. 4.
Fig. 4.
Determination of IgH VDJ recombination across cells and clones clustered by Jaccard distance. (A) Patient 4 represents a pattern seen for three of six patients, with the use of a single VH segment in the rearranged VDJ sequences. (B) Patient 5 had two rearranged alleles detected in both clones. (C) Patient 1 had a significant fraction of VH-replacement clones. In addition, in clone 1 EYA4 mutation closely segregates with VH-segment IGHV3-33*01 (dashed box), suggesting it is a separate clone with a unique IgH sequence. Clone 2 had a much higher rate of VH-replacement, as well as rate of no VDJ calls. (D) Patient 2 clone 4 almost exclusively used IGHV3-64*01, whereas the other clones had high levels of VH replacement and no VDJ sequence calls. Black box represents the VH segment call for the VDJ sequence detected in each cell, whereas the white box represents no call.
Fig. 5.
Fig. 5.
Temporal ordering of events in the development of ALL. ETV6-RUNX1 translocation occurs in utero, followed by preleukemic evolution as a result of further genomic structural variation. The outgrowth of multiple dominant clones is then driven by cytosine mutations causing branching evolution. IgH rearrangement can occur before mutation acquisition, or continue to be ongoing in the most evolved clones.

References

    1. Kandoth C, et al. Mutational landscape and significance across 12 major cancer types. Nature. 2013;502(7471):333–339. - PMC - PubMed
    1. Mullighan CG, et al. Genomic analysis of the clonal origins of relapsed acute lymphoblastic leukemia. Science. 2008;322(5906):1377–1380. - PMC - PubMed
    1. Welch JS, et al. The origin and evolution of mutations in acute myeloid leukemia. Cell. 2012;150(2):264–278. - PMC - PubMed
    1. Walter MJ, et al. Clonal architecture of secondary acute myeloid leukemia. N Engl J Med. 2012;366(12):1090–1098. - PMC - PubMed
    1. Ding L, et al. Clonal evolution in relapsed acute myeloid leukaemia revealed by whole-genome sequencing. Nature. 2012;481(7382):506–510. - PMC - PubMed

Publication types

Associated data