

doi: 10.1177/108471389600100402.
Real-ear measurement of hearing threshold and loudness
Affiliations
- PMID: 25425857
- PMCID: PMC4172257
- DOI: 10.1177/108471389600100402
Item in Clipboard
Real-ear measurement of hearing threshold and loudness
Trends Amplif.
1996 Dec.
No abstract available
Figures

Schematic illustration of the arrangement of the equipment used in the RELM prototype system.
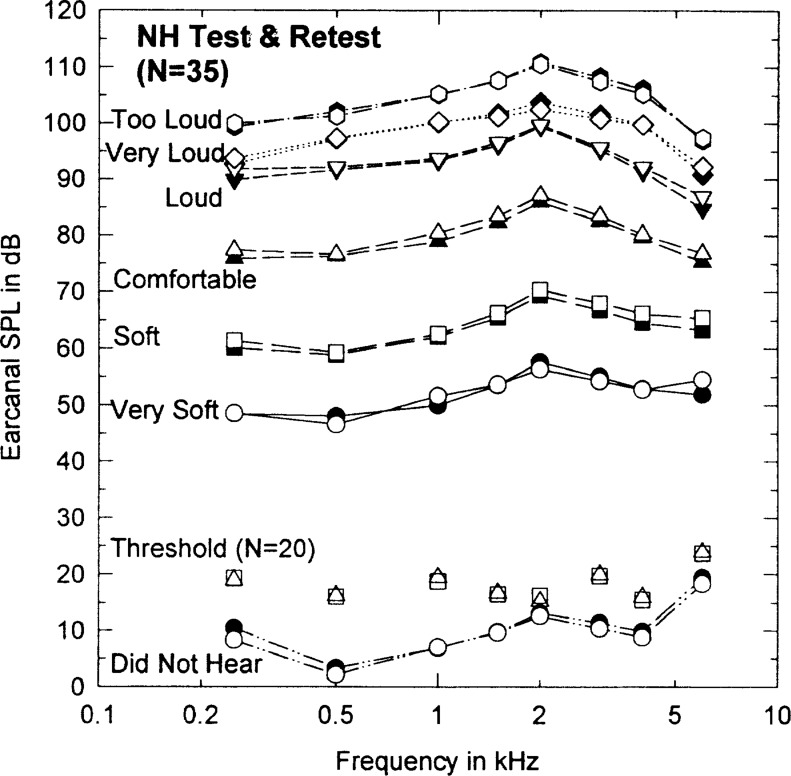
Mean test (filled symbols) and retest (unfilled symbols) data for the RELM loudness ratings from 35 normal-hearing adults. Mean threshold values for test (triangles) and retest (squares), measured with clinical procedures and equipment for 20 of the 35 subjects, are shown as unfilled, unconnected symbols near the bottom of the figure.

Mean standard deviations (unfilled bars) and 5th–95th percentile ranges (striped bars) for the signed test-retest differences for the RELM loudness ratings.

Comparison of adjusted RELM loudness contours (symbols connected by dotted lines) to adjusted equal-loudness contours in phons from Robinson and Dadson (1956). See text for a description of the various adjustments required to enable this comparison.

Mean test (filled symbols) and retest (unfilled symbols) 1/3-octave levels for the speech noise presented at levels fo 50, 65 and 80 dB SPL.

Mean standard deviations (unfilled bars) and 5th–95th percentile ranges (striped bars) for the signed test-retest differences for the RELM speech-noise measurements averaged across the 65 and 80 dB presentation levels.

Comparison of RELM speech-noise 1/3-octave levels (unfilled symbols) to the targeted 1/3-octave levels (solid lines) from the pending ANSI standard on the Speech Intelligibility Index (SII). All dB values are in sound-field SPL.

Overlay of the three speech-noise contours at 50, 65 and 80 dB from Figure 5 (retest values) on top of the RELM loudness contours from Figure 2 (test values). The unfilled circles at the higher frequencies for the 50-dB speech noise represent estimates of the true speech spectrum unaffected by the noise floor. These values were estimated from the differences between measured and targeted 1/3-octave levels for the 50-dB speech noise at the frequencies (observed previously in Figure 7).
Similar articles
-
Comparison of normal and impaired hearing. I. Loudness, localization.Scand Audiol Suppl. 1978;(6):49-79. Scand Audiol Suppl. 1978. PMID: 292154
-
Signal delivery/real ear measurement system for hearing aid selection and fitting.Ear Hear. 1992 Dec;13(6):460-3. Ear Hear. 1992. PMID: 1342584
-
Tinnitus in a single-sided deaf ear reduces speech reception in the nontinnitus ear.Otol Neurotol. 2013 Jun;34(4):662-6. doi: 10.1097/MAO.0b013e31828779f0. Otol Neurotol. 2013. PMID: 23640086
-
Guidelines for the evaluation of hearing aid fitting (2010).Auris Nasus Larynx. 2016 Jun;43(3):217-28. doi: 10.1016/j.anl.2015.10.015. Epub 2015 Dec 2. Auris Nasus Larynx. 2016. PMID: 26654157 Review.
-
Loudness balance procedures for the measurement of recruitment.Audiology. 1977 May-Jun;16(3):215-28. Audiology. 1977. PMID: 327993 Review.
Cited by
-
Evaluating hearing performance with cochlear implants within the same patient using daily randomization and imaging-based fitting - The ELEPHANT study.Trials. 2020 Jun 23;21(1):564. doi: 10.1186/s13063-020-04469-x. Trials. 2020. PMID: 32576247 Free PMC article.
-
Development of digital hearing AIDS.Trends Amplif. 1997 Jun;2(2):41-77. doi: 10.1177/108471389700200202. Trends Amplif. 1997. PMID: 25425875 Free PMC article. No abstract available.
-
Curriculum for graduate courses in amplification.Trends Amplif. 1998 Mar;3(1):6-44. doi: 10.1177/108471389800300102. Trends Amplif. 1998. PMID: 25425878 Free PMC article. No abstract available.
References
-
- Allen JB, Hall JL, Peng PS. (1990). Loudness growth in 1/2-octive bands (LGOB)—A procedure for the assessment of loudness. J Acoust Soc Am 88:745–753 - PubMed
-
- American National Standards Institute. (1989). Specifications for audiometers, ANSI S3.6–1989. New York: American National Standards Institute
-
- American National Standards Institute (pending). Methods for the calculation of the speech intelligibility index, ANSIS3.79. Draft version 3.1, 7/3/93. New York: American National Standards Institute
-
- Bentler RA, Pavlovic CV. (1989). Transfer functions and correction factors used in hearing aid evaluation and research. Ear Hear 10:58–63 - PubMed
-
- Berger KW. (1984). The Hearing Aid; Its Operation and Development, 3rd ed. National Hearing Aid Society
LinkOut - more resources
Full Text Sources