

doi: 10.1177/108471389800300202.
Optimizing sound localization with hearing AIDS
Affiliations
- PMID: 25425879
- PMCID: PMC4172152
- DOI: 10.1177/108471389800300202
Item in Clipboard
Optimizing sound localization with hearing AIDS
Trends Amplif.
1998 Jun.
No abstract available
Figures

Main cues for localizing sounds in the horizontal plane: interaural time and intensity differences. Signals arrive later and are softer in the far ear when compared to the near ear.
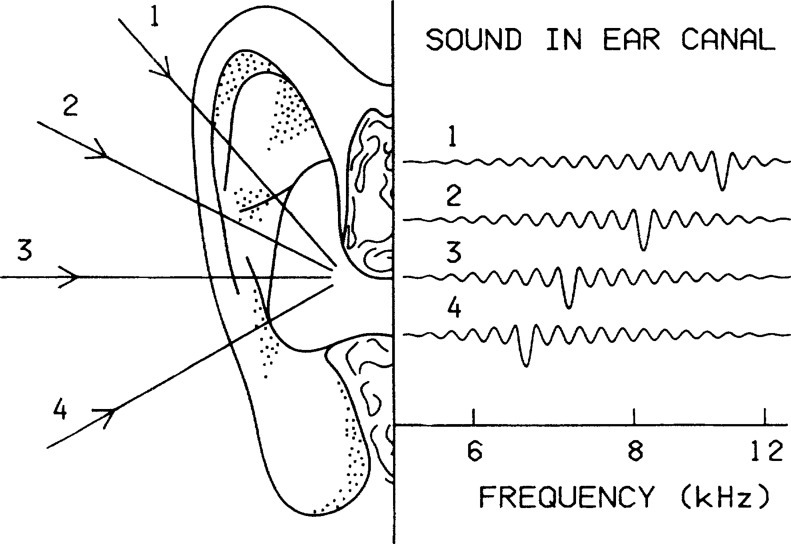
Main cue for localizing sounds in the vertical plane: elevation dependent differences in the high frequency spectrum resulting from pinnae reflections.
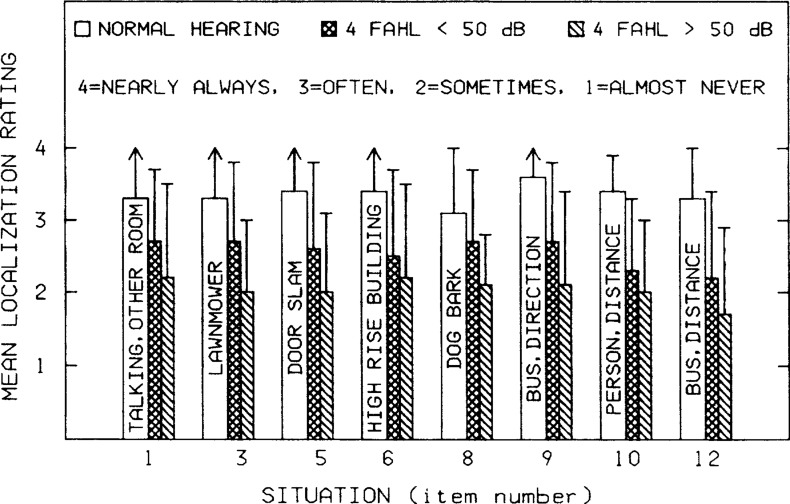
Ratings (mean and + 1 SD) of sound localization ability on eight tasks by groups of people with normal hearing and two degrees of hearing-impairment (four-frequency average HTLs less than or greater than 50 dB). Bars indicate one SD and arrows show where the mean rating plus one SD exceeded the maximum rating of “4”. Reprinted with permission from J Am Acad Audiol (Noble et al, 1995).
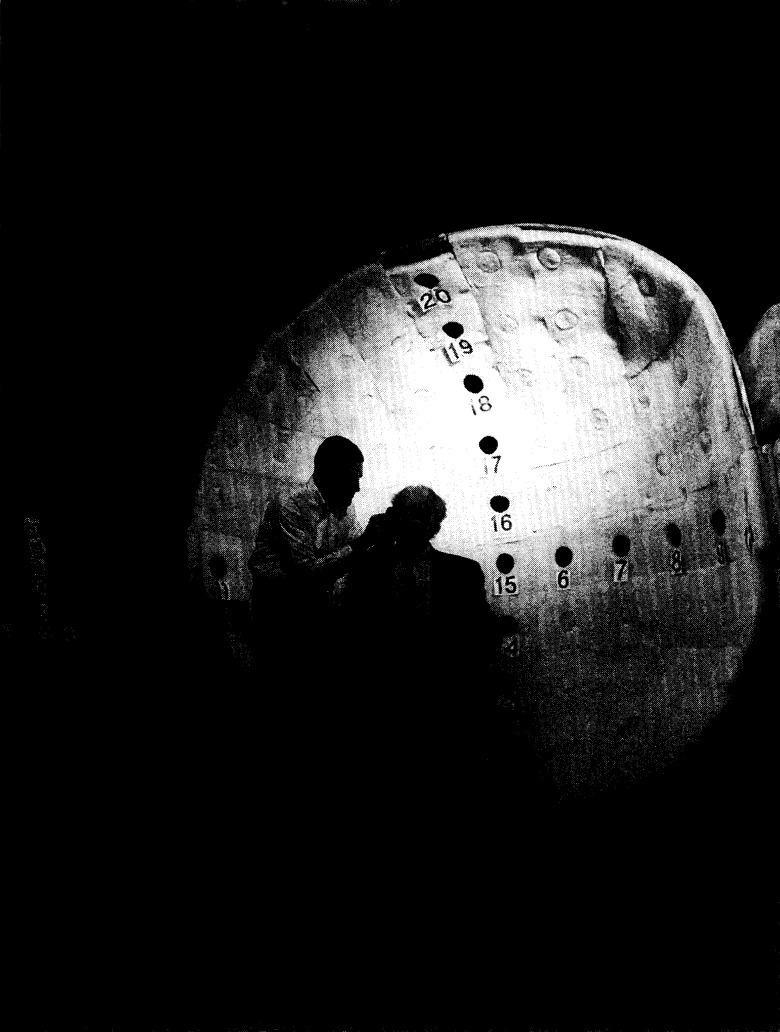
Test array used in several localization studies (e.g. Byrne et al, 1998; Noble et al, 1998). A horizontal arc of 11 loudspeakers forms the circumference of a circle with a radius of 1.1 m. The subject is seated on a chair with its height adjusted so that the subject's ears are level with the horizontal loudspeakers. There is a vertical arc of the same size but containing only 10 loudspeakers as there is no loudspeaker directly below the subject. Bursts of noise are presented in random order from each loudspeaker and the subject judges which location was the sound source. For some testing, the subject faces the array and for other tests is turned sideways to the array. In this picture the subject (right) is being prepared for aided testing. The cross shaped “map” to the left of the array is an aid to remembering the loudspeaker positions when the subject is sideways to the array.

Schematic summary of the effects of sensorineural and conductive/mixed hearing loss on horizontal and vertical sound localization. The main trends are: horizontal localization decreases as hearing loss at the low frequencies (<1500 Hz) increases (left panel); vertical localization decreases as hearing loss at the high frequencies (>4000 Hz) increases (right panel); horizontal localization is poorer for conductive/mixed hearing loss than for sensorineural hearing loss (left panel). The figure provides only a broad indication of the trends shown by data reported in Noble et al (1994; 1997). The correlations between hearing level and localization are only moderate and data for conductive mixed loss are limited.
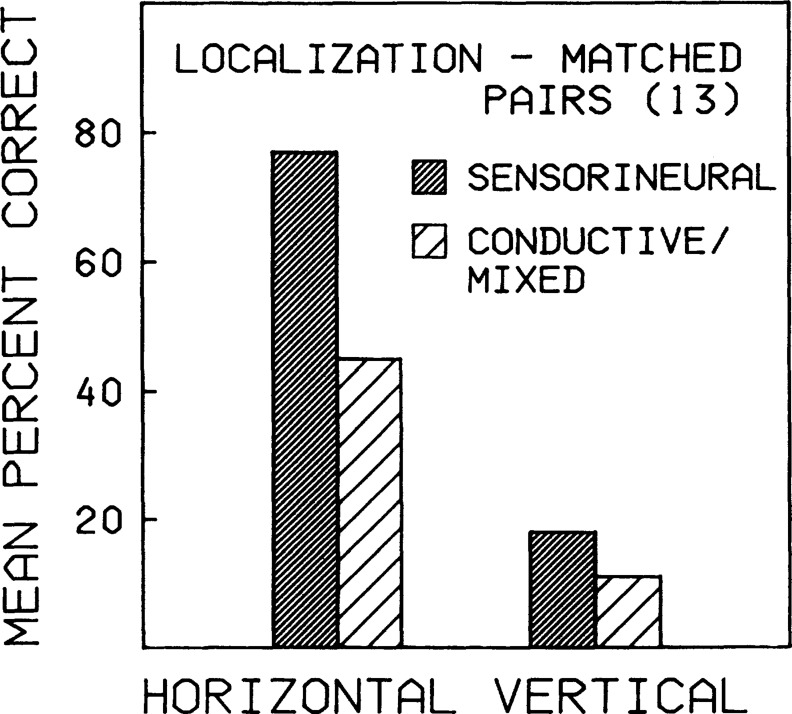
Comparison of sound localization ability for pairs of people with sensorineural versus conductive/mixed hearing losses, matched for four-frequency average hearing level.

Comparison of horizontal localization ability for bilateral versus unilateral fittings, for BTE versus ITE hearing aids, and for two presentation levels. Reprinted (modified) with permission from J Am Acad Audiol (Byrne et al, 1992).

Illustration of how type of fitting (bilateral versus unilateral) affects horizontal sound localization (for BTE aids with sounds presented at MCL) as HTL increases. The closed and open circles show individual data (localization error score versus 4FA HTL) for 35 bilaterally and 23 unilaterally fitted subjects, respectively. The solid and broken lines are the regression lines for predicting error score from HTL for bilateral and unilateral fittings, respectively. Reprinted (modified) with permission from J Am Acad Audiol (Byrne et al 1992).

Comparison of sound localization ability, horizontal and vertical, for BTE and ITE hearing aids. (ITE scores adjusted by the difference between unaided scores for the two aid types.) The numbers of subjects with each type of fitting are: unilateral BTE = 23; unilateral ITE = 17; bilateral BTE = 35; bilateral ITE = 12.
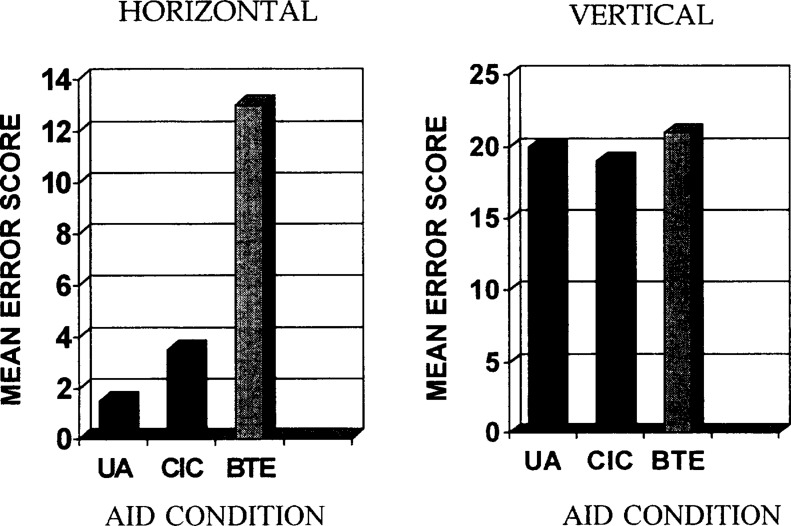
Comparison of sound localization ability, horizontal and vertical, for unaided, CIC and BTE hearing aids. (Note: there are only four listeners and all were experienced CIC wearers. Because of large individual variability, the difference in horizontal localization between the CIC and BTE condition is not significant at the 95% confidence level.)
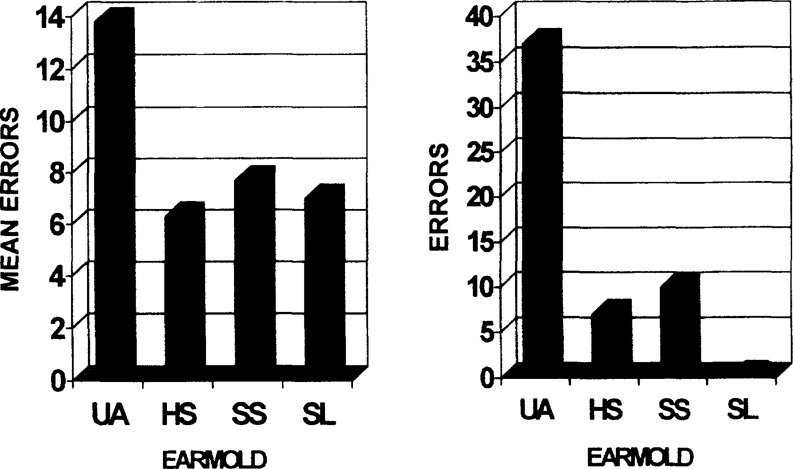
Effects of earmold type (UA = unaided; HS = hard material, short canal; SS = soft, short; SL = soft, long) on horizontal localization by subjects with conductive/mixed hearing loss. Left panel shows group average results (n = 19), right panel presents an illustrative case. (Chance performance is an error score of 40.) Reprinted (modified) with permission from Ear Hear (Byrne et al, 1996).
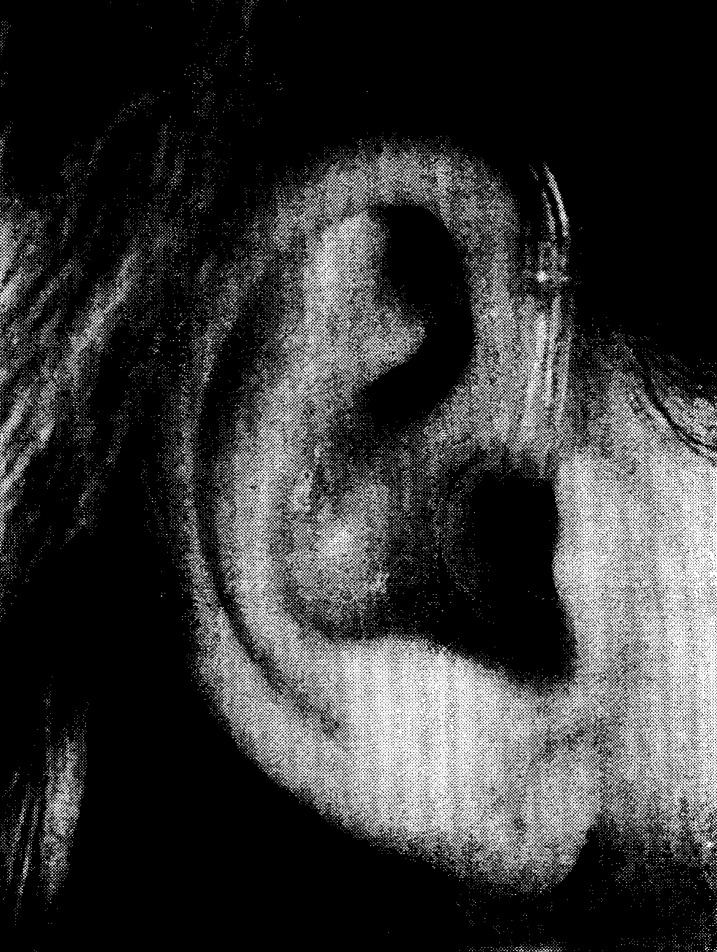
Illustration of the clinical version of the sleeve earmold. (This is slightly different from the earlier research version.) The earmold fits entirely within the ear canal except for a 1 mm wide flange at the outer end. This earmold has walls that are only 0.5 mm thick and provides no significant occlusion of the ear. (Construction details are at the end of this section.)
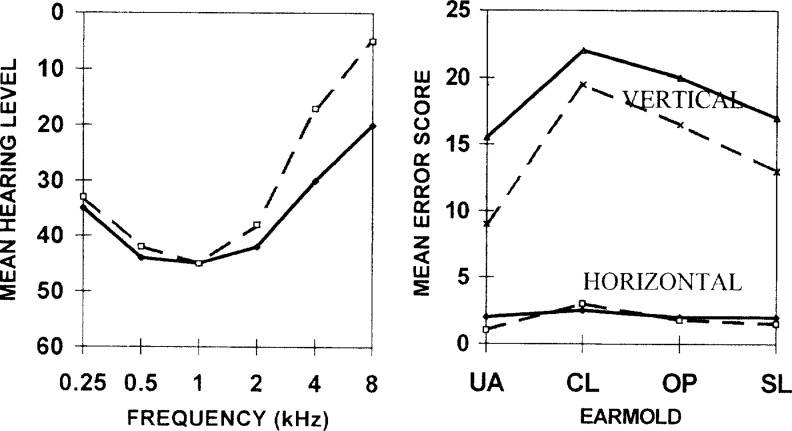
Effects of earmold type (UA = unaided; CL = closed; OP = open; SL = sleeve) on horizontal and on vertical sound localization for subjects with moderate low-frequency hearing losses and good high frequency hearing. Localization data and audiograms are shown (solid lines) as a group (n = 22) and for those listeners with high frequency average 6000 Hz and 8000 Hz) HTLs of 20 dB or less (broken lines).

Effects of earmold type (UA = unaided; CL = closed; OP = open; SL = sleeve) on horizontal sound localization for subjects with good low-frequency hearing and poor high frequency hearing. Group (n = 9) audiogram is shown in left panel and localization data are shown in right panel.

Parts of the “hi-fi” experimental hearing aid. The earmolds fit entirely within the ear canal and each contains an earphone and microphone. Leads from each transducer terminate in a plug that connects with leads attached to laboratory equipment that amplifies and equalizes to provide a flat insertion frequency response to 10,000 Hz.
References
-
- Barcham LJ, Stephens SDG. (1972). The use of an open-ended problems questionnaire in auditory rehabilitation. Br J Audiol 14: 49–54 - PubMed
-
- Bauer RW, Matusza JL, Blackmer RF. (1966). Noise localization after unilateral attenuation. J Acoust Soc Amer 40: 441–444
-
- Butler RA. (1987). An analysis of the displacement of sound in space. Percept Psych 41: 1–7 - PubMed
-
- Byrne DJ, Dermody P. (1975). Localization of sound with binaural body-worn hearing aids. Br J Audiol 9: 107–115
-
- Byrne D, Dirks D. (1996). Effects of acclimatization and deprivation on non-speech auditory abilities. Ear Hear 17: 29S–37S - PubMed
LinkOut - more resources
Full Text Sources
Other Literature Sources