

doi: 10.1177/108471389800300302.
The causes and effects of distortion and internal noise in hearing AIDS
Affiliations
- PMID: 25425880
- PMCID: PMC4172235
- DOI: 10.1177/108471389800300302
Item in Clipboard
The causes and effects of distortion and internal noise in hearing AIDS
Trends Amplif.
1998 Sep.
No abstract available
Figures
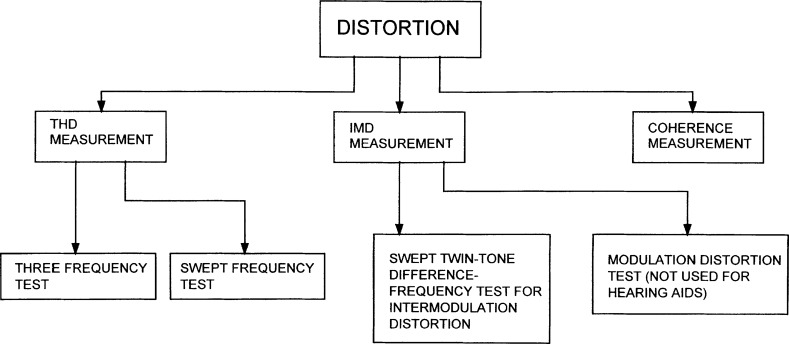
An overview of the three major types of distortion measurement commonly used for quantifying hearing aid distortion and the methods by which each is accomplished.

Harmonic distortion components present in a hearing aid adjusted below saturation with an input signal of 1000 Hz. This graph clearly reveals 2nd and 3rd harmonics present at 2000 Hz and 3000 Hz, respectively. Table 1 lists the corresponding numerical values for the three output frequencies.

Example of a printout from the measurement of a hearing aid according to ANSI standard S3.22 (1996).

Data from a hearing aid showing the measured three-frequency ANSI data, compared to a graph showing the levels of THD that occurred as the distortion was measured continuously between 200 Hz and 6200 Hz.

Output of a linear hearing aid tested with the signal shown in Figure 6, with the test signal subtracted in order to reveal residual products in the output. The output shown in this graph is the resulting IMD with energy primarily in the 500 Hz to 2000 Hz region.

Test signal consisting of a band of noise with energy primarily between 3500 Hz and 8500 Hz, used to simulate an extended sibilant speech sound.

Example of coherence measurements from two hearing aids.
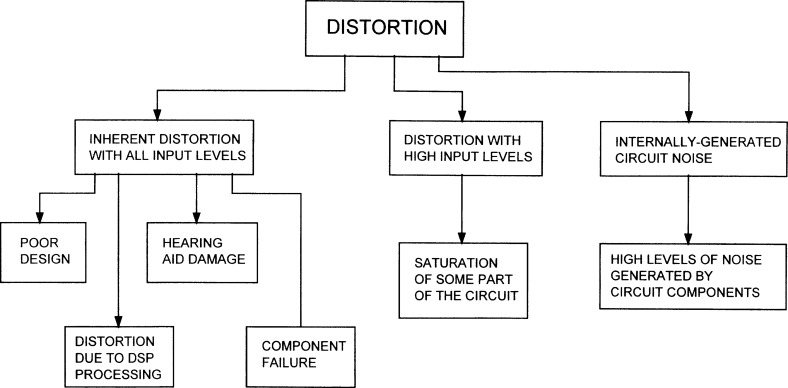
Diagram illustrating the relationship of different categories of distortion to some of the possible causes.

The effects of peak clipping on a sine wave.

Graph of output versus frequency for the hearing aid measured in Figure 2, showing HD present when the hearing aid was driven into saturation.

Graph showing the SSPL90 of a hearing aid (black line), and the output level (dashed line) at which 10% distortion occurred.

Graphs of a comparison of THD on a scale of 0% to 50% measured on three hearing aids, showing the difference in distortion levels that were obtained when measured with two different input levels.

An example of graphs of the results of swept-frequency measurements for a linear hearing aid, using input levels of 60, 70, 80 and 90 dB SPL input.

Examples of scales used to record subject responses in sound quality testing.

Example of a noise spectrum measurement of the internal noise of a hearing aid with 40 dB of gain.

Acoustic output noise measured for two hearing aids with the same ANSI specifications, but using different amplifiers.
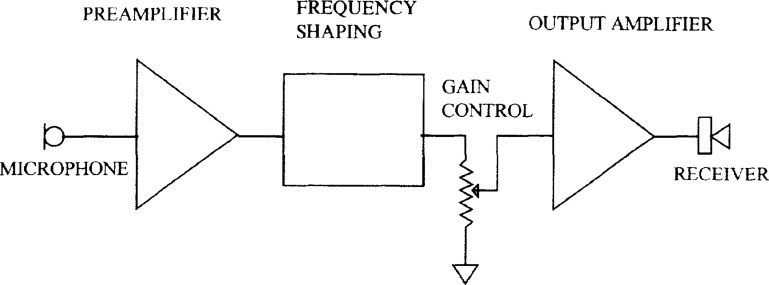
Generic block diagram of a hearing aid, for reference in the discussion of saturation distortion.

Approximate dynamic range of the ear, a typical linear hearing aid, a compact disc (CD), and analog tape.

Example of 1/3-octave measurement of the internal noise of a hearing aid, showing values for the hearing aid measured in Figure 15.

Simplified schematic representation of the perception of internally-generated hearing aid noise traveling from the amplifier noise source to the auditory cortex. Row A illustrates the signal path, row B represents the transfer functions of the components of the signal path, and row C represents the effect of the transfer functions on the noise.

Example of plotting the SPL audiogram on 1/3-octave band measurements of output noise from a hearing aid.
References
-
- Agnew J. (1988). Hearing instrument distortion: what does it mean for the listener? Hear Instr 39 (10):10, 12,, 14,, 16,, 20,, 61
-
- Agnew J. (1991). Advanced digital signal processing schemes for ITEs. Hear Instr 42 (9):13–14, 16–17
-
- Agnew J. (1994). Measurement of distortion levels in hearing aids; it's not a simple matter. Hear J 47 (5):25–27, 30–32
-
- Agnew J. (1995). The saturation distortion problem in hearing aids: causes and a solution. Hear J 48 (8):33–34, 36–38
-
- Agnew J. (1996a). Perception of internally-generated noise in hearing amplification. J Am Acad Audiol 7 (4): 296–303 - PubMed
LinkOut - more resources
Full Text Sources
Other Literature Sources