

doi: 10.1177/108471389900400208.
Verification: issues and implementation
Affiliations
- PMID: 25425891
- PMCID: PMC4172164
- DOI: 10.1177/108471389900400208
Item in Clipboard
Verification: issues and implementation
Trends Amplif.
1999 Jun.
No abstract available
Figures

Distortion values obtained during the verification stage (upper panel) and following a small adjustment of the AGC-O threshold kneepoint (lower panel).

Comparison of test-retest standard deviations for insertion gain and functional gain. Probe tube insertion gain obtained from CCI-10 = Rastronics CCI-10, HA-2000 = Acoustimed HA 2000, IGO = Madsen IGO, and F6500 = Frye 6500. Modified with permission from Humes and Kirn (1990). The reliability of functional gain. J Speech Hear Dis 55:193–197, Figure 4.

Real ear unaided responses (REURs) obtained before (upper panel) and after (lower panel) closure of a tympanic membrane perforation. Reprinted with permission from Moryl et al (1992). Real ear unaided responses in ears with tympanic membrane perforations. J Amer Acad Audiol 3:60–65.
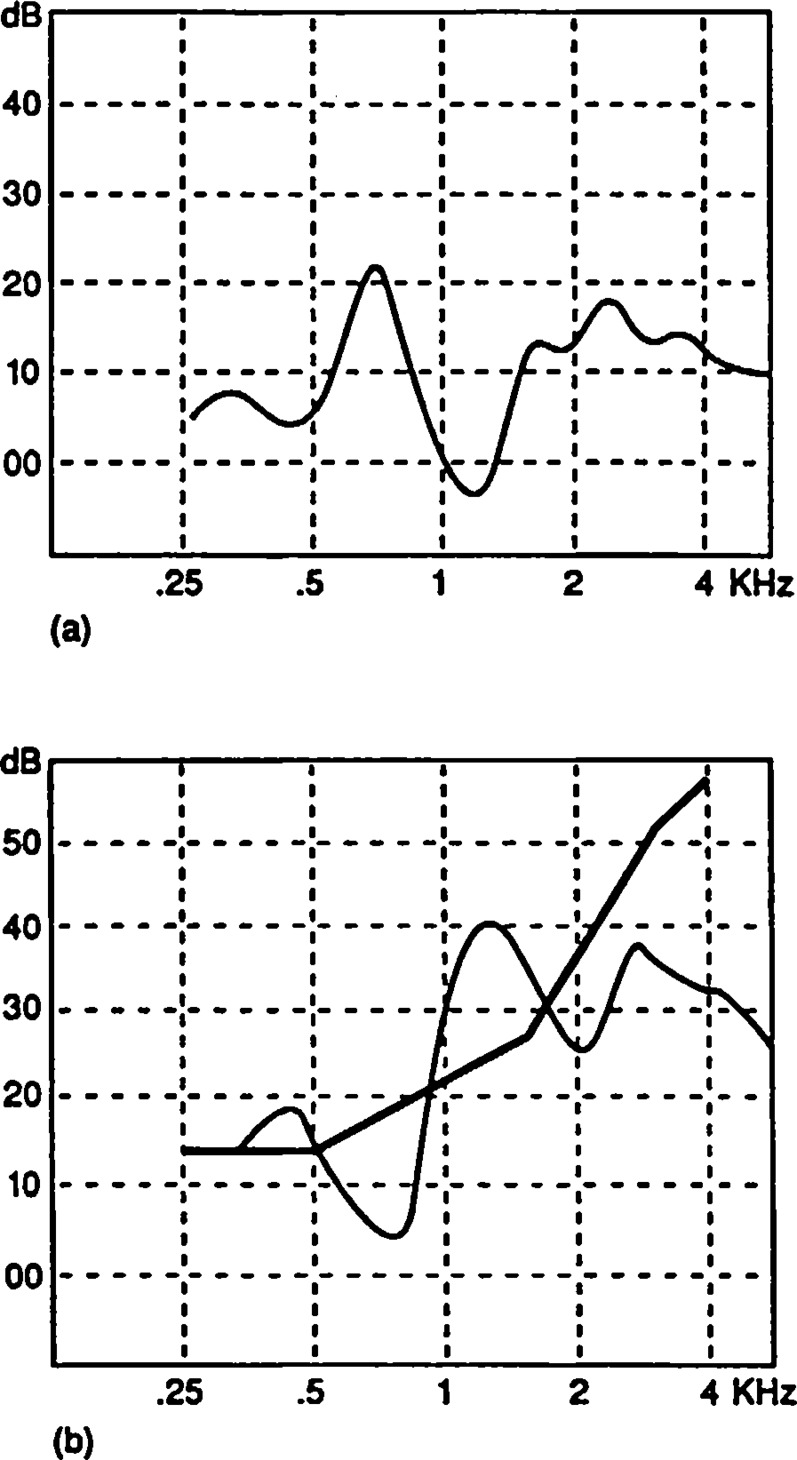
Real ear unaided responses (REURs) obtained with a large perforation (upper panel) and real ear insertion gain (REIR) with hearing aid (lower panel). The dark line is the target curve. Measures were obtained with a Madsen IGO probe microphone system. Reprinted with permission from Moryl et al (1992). Real ear unaided responses in ears with tympanic membrane perforations. J Amer Acad Audiol 3: 60–65.

Real ear to coupler differences (RECDs) obtained using the Moodie et al (1994) procedure on a FONIX 6500 probe microphone system, shown with an old, loose fitting earmold (upper panel), and new, long canal earmold (lower panel).
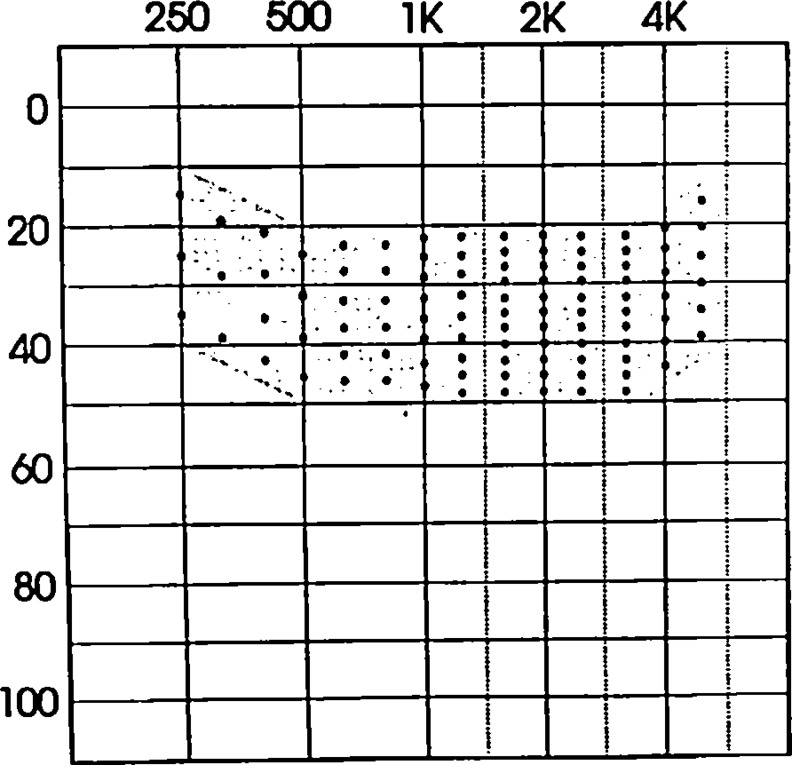
One example of a count-the-dot audiogram. Reprinted with permission from Mueller and Killion (1990). An easy method for calculating the Articulation Index. The Hearing Journal 43(9):14–17.

Audiogram with frequency spectrum of familiar sounds. Reprinted with permission from Northern JL, Downs MP. (1991). Hearing in Children. Baltimore, MD: Waverly Press.

Printout from SHARP Program showing audibility of four different spectra relative to the child's thresholds and electroacoustic characteristics of the chosen hearing aid.

Apparatus for measuring the response of an insert earphone in an HA-2 coupler (a, left) and in the ear of a child (b, right) for determining the real-ear-to-coupler difference (RECD). Reprinted with permission from Moodie KS, Seewald RC and Sinclair S. (1994). Procedure for predicting real ear hearing aid performance in young children. Amer J Audiol 3:23–31.
References
-
- American Speech-Language-Hearing Association. (1998). Guidelines for hearing aid fitting for adults. Amer J Audiol 75–13
-
- ANSI S3.22-1996 American National Standard Specification of Hearing Aid Characteristics. New York: American National Standards Institute
-
- ANSI S3.21-1992 American National Standard Method for Manual Pure-Tone Threshold Audiometry. New York: American National Standards Institute
-
- ANSI S3.42-1992 American National Standard Testing Hearing Aids with a Broad-Band Noise Signal. New York: American National Standards Institute
-
- ANSI S3.5-1997 American National Standard Methods for the Calculation of the Speech Intelligibility Index. New York: American National Standards Institute
LinkOut - more resources
Full Text Sources