. 2014 Nov 11:5:566.
doi: 10.3389/fmicb.2014.00566. eCollection 2014.

Life in the slow lane; biogeochemistry of biodegraded petroleum containing reservoirs and implications for energy recovery and carbon management

Affiliations

Life in the slow lane; biogeochemistry of biodegraded petroleum containing reservoirs and implications for energy recovery and carbon management

Ian M Head et al. Front Microbiol. .

Abstract

Our understanding of the processes underlying the formation of heavy oil has been transformed in the last decade. The process was once thought to be driven by oxygen delivered to deep petroleum reservoirs by meteoric water. This paradigm has been replaced by a view that the process is anaerobic and frequently associated with methanogenic hydrocarbon degradation. The thermal history of a reservoir exerts a fundamental control on the occurrence of biodegraded petroleum, and microbial activity is focused at the base of the oil column in the oil water transition zone, that represents a hotspot in the petroleum reservoir biome. Here we present a synthesis of new and existing microbiological, geochemical, and biogeochemical data that expands our view of the processes that regulate deep life in petroleum reservoir ecosystems and highlights interactions of a range of biotic and abiotic factors that determine whether petroleum is likely to be biodegraded in situ, with important consequences for oil exploration and production. Specifically we propose that the salinity of reservoir formation waters exerts a key control on the occurrence of biodegraded heavy oil reservoirs and introduce the concept of palaeopickling. We also evaluate the interaction between temperature and salinity to explain the occurrence of non-degraded oil in reservoirs where the temperature has not reached the 80-90°C required for palaeopasteurization. In addition we evaluate several hypotheses that might explain the occurrence of organisms conventionally considered to be aerobic, in nominally anoxic petroleum reservoir habitats. Finally we discuss the role of microbial processes for energy recovery as we make the transition from fossil fuel reliance, and how these fit within the broader socioeconomic landscape of energy futures.

Keywords: biogeochemistry; energy; hydrocarbon biodegradation; microbial ecology; oil reservoirs.


Figures

Figure 1
Figure 1
The effect of oil and water-washed oil on rates of methanogenesis from H2/CO2 (left), acetate (middle), and methanol (right). Laboratory microcosms amended with oil which had been washed with brine to different degrees was evaluated. North Sea oil (50 g) was washed with 100 ml brine (1% w/v NaCl in deionized water) in a separating funnel from 1 to 4 times and the unwashed and washed oil (300 mg) was added to serum bottles containing a slurry of river sediment (River Tyne, UK) amended with each of the methanogenic substrates. Control incubations containing bromoethanesulfonic acid (BES), an inhibitor of methanogenesis were also prepared. Rates of methane production were measured by gas chromatography of headspace samples (E. Bowen, previously unpublished data).
Figure 2
Figure 2
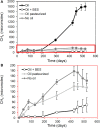
Effect of pasteurization in methanogenesis and methanogenic oil biodegradation in laboratory microcosms. Panel (B) is a blow up of the red box in (A). This demonstrates that following pasteurization (90°C for 2 h) methanogenesis attributable to oil biodegradation (“Oil” in A) is reduced. The data from pasteurized control microcosms amended with oil suggest that methanogens remain active, even after pasteurization has removed hydrocarbon degrading activity. This is evident from the fact that pasteurization does not completely inhibit methanogenesis but brings methane production levels in line with that seen in background control incubations (No oil) to which no oil was added suggesting that the capacity for conversion of alkanes to methane has been removed by pasteurization, but not the ability to generate methane from indigenous organic carbon in the sediments (A. Rowan, previously unpublished data).
Figure 3
Figure 3
Oil production wells (circles) near the Peace River tar sands (gray shaded areas) in Alberta (A). Isotherms indicate in situ temperatures of crude oil deposits. Consistent with palaeopasteurization, we recently recovered microbial intact polar lipids in produced water samples from wells east of the 80°C isotherm (●) but not from more western reservoirs (○) that are above 80°C (Oldenburg et al., 2009). Panel (B) shows that microbial activity (methanogenesis from yeast extract) was readily stimulated in samples from eastern fields lower than 80–90°C in situ (dashed line) but not from deeper, hotter fields to the west (N. Gray, unpublished data).
Figure 4
Figure 4
Effect of increasing salinity on energy (ATP) requirement/cell for osmoregulation. The upper and lower lines in each pair of lines relates to the upper and lower values quoted by Oren (1999). Calculations were based upon the following assumptions; Intracellular solute concentration is regulated to match the extracellular salinity; For organic solutes 2 molecules are required per salt molecule (1 molecule of salt produces 2 ions); Cells are cocci (spheres) of 0.5 microns in diameter. Note log scale, thus there is a linear increase in energy demand with increasing salinity.
Figure 5
Figure 5
Methanogenesis from acetate, hydrogen and CO2 and methanol in anoxic incubations of River Tyne sediments incubated at 30°C (left panel) and 60°C (right panel) over a range of salt concentrations from 1 to 137 g/l. The maximum salt tolerance for methanogenesis is lower at higher temperature indicating an interaction between salinity and temperature (H. Coombs, previously unpublished data). At 60°C methanogenic activity is inhibited above 46 g/l indicated by the dashed vertical red line.
Figure 6
Figure 6
The effect of hydrogen partial pressure on the free energy yield from oxidation of hexadecane to hydrogen and CO2 (blue), fermentation of hexadecane to hydrogen and acetate (red) and syntrophic acetate oxidation (green).
Figure 7
Figure 7
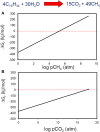
Free energy yield from methanogenic hexadecane degradation at a range of methane (A) and carbon dioxide (B) partial pressures.
Figure 8
Figure 8
The effect of methane partial pressure on the thermodynamic feasibility of (A) methanogenic CO2 reduction and (B) acetoclastic methanogenesis.
Figure 9
Figure 9
The effect of methane or CO2 partial pressure on the thermodynamic feasibility of acetoclastic methanogenesis at different acetate concentrations. At micromolar levels of acetate, acetoclastic methanogenesis becomes thermodynamically unfavourable at modest levels of methane or CO2.
Figure 10
Figure 10
Comparative analysis of bacterial community DGGE profiles from crude oil degrading microcosms incubated under different electron-accepting conditions and communities in the sediment used to inoculate the sediments. Distinct communities were selected under different electron accepting conditions. The numbers at nodes represent the percentage of trees in which the group to the right of the node was recovered in datasets subject to bootstrap resampling (100 replicates) and gives an indication of the confidence that can be placed in the groups recovered. The scale represents 10% difference in the community composition based on Dice similarity of pair-wise comparisons of DGGE profiles.
Figure 11
Figure 11
The effect on thermodynamic yields of progressive changes in sulfate, sulfide and bicarbonate concentration during hexadecane degradation coupled to sulfate reduction (C16H34 + 12.25SO2−4 + 8.5H+ → 16HCO3 + 12.25H2S + H2O). For each set of sulfate, sulfide and bicarbonate conditions (A–C) energy yields were calculated for a range of acetate concentrations and a fixed hydrogen partial pressure for a hypothetical microbial consortium comprising: (red circles and line) hexadecane fermentation to hydrogen and acetate (C16H34 + 16H2O → 8CH3COO + 8H+ + 17H2), (blue circles and line) hydrogen oxidation coupled to sulfate reduction (17H2 + 8.5H+ + 4.25SO2−4 > 4.25H2S + 17H2O), (green circles and line) Acetate oxidation coupled to sulfate reduction (8CH3COO + 8H+ + 8SO2−4 > 16HCO3 + 8H2S). Calculations were performed using the concentrations indicated in each panel. All other conditions used in calculations were fixed e.g., 20°C, pH7 and fixed hexadecane (aqueous solubility) and hydrogen partial pressures pH2 (10−6 atms). The vertical dashed line represents a typical threshold level for acetate in sulfate reducing systems.
Figure 12
Figure 12
Plot of the ratios of n-heptadecane to pristane against the 4-methylbiphenyl to 3-methylbiphenyl ratio from North Sea crude oil degraded in laboratory anaerobic microcosm experiments under sulfate-reducing (SR, blue) and methanogenic (M, red) conditions and field-degraded oils from the North Sea Gullfaks field (Gullfaks, gray). Error bars for the peak ratios are ±1 SE (n = 3). The laboratory methanogenic microcosm data and the field data plot along the same biodegradation trajectory with n-alkane degradation but no apparent aromatic hydrocarbon degradation, while the sulfate-reducing microcosm data show the concomitant degradation of n-alkanes and aromatic hydrocarbons under different electron accepting conditions.
Figure 13
Figure 13
Changes in nC18 to phytane ratio with total C7 to C26 (1-methylalkyl)succinates (μg) in methanogenic microcosms (open circles) and sulfate-reducing microcosms (filled circles) over 686 days of anaerobic hydrocarbon degradation. Error bars, where shown, are ± one standard error of replicate microcosms where n = 3. The dotted arrow indicates the temporal changes in alkylsuccinate concentration under sulfate-reducing conditions.
Figure 14
Figure 14
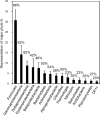
Frequency distribution of 16S rRNA sequences (classified into major phylogenetic groups) recovered in clone libraries from hydrocarbon impacted environments. Bars correspond to average percent representation of major phyla (1× SE) based on a survey of 26 bacterial clone libraries. Values shown above the columns indicate the percentage of studies in which the phylum was identified. Modified from Gray et al. (2010).
Figure 15
Figure 15
Proposed systems for energy recovery from stranded, residual oil in petroleum reservoirs. (A) Enhanced oil and gas recovery by stimulation of methanogenic oil biodegradation and (B) a bioelectrochemical system for the direct recovery of energy, as electricity from residual and heavy oil. Organic carbon (Corg), Increase in pressure from gas generation (ΔP), decrease in oil viscosity due to gas dissolving in oil (Δη).
Figure 16
Figure 16
The carbon management and energy universe; Our best estimate of the likely development routes for different energy resources over the next few decades. The y-axis indicates the timescale to large-scale removal (reduction to 20% of market share, or deployment of a technology type (expansion beyond 20% of market share), and on the x-axis social acceptance and thus deployability of the technology type.

References

    1. Achenbach L. A., Bender K. S., Sun Y., Coates J. D. (2006). The biochemistry and genetics of microbial perchlorate reduction, in Perchlorate, Environmental Occurrence, Interactions, and Treatment, eds Gu B., Coates J. D. (New York, NY: Springer Publishers; ), 297–310.
    1. Adams J. J. (2008). The Impact of Geological and Microbiological Processes on Oil Composition and Fluid Property Variations in Heavy Oil and Bitumen Reservoirs. Ph.D. thesis, University of Calgary.
    1. Adams J. J., Jiang C., Bennett B., Huang H. P., Oldenburg T. B. P., Noke K., et al. (2008). Viscosity determination of heavy oil and bitumen. Cautions and solutions, in World Heavy Oil Conference Edmonton Paper (Calgary, AB: DMG World Media; ), 2008–443.
    1. Adams J. J., Riediger C., Fowler M., Larter S. R. (2006). Thermal controls on biodegradation around the Peace River tar sands: Paleo-pasteurization to the west. J. Geochem. Explor. 89, 1–4 10.1016/j.gexplo.2005.11.004 - DOI
    1. Adams J. J., Rostron B. J., Mendoza C. A. (2004). Coupled fluid flow, heat and mass transport, and erosion in the Alberta basin: implications for the origin of the Athabasca oil sands. Can. J. Earth Sci. 41, 1077–1095 10.1139/e04-052 - DOI