. 2014 Nov 11:5:608.
doi: 10.3389/fpls.2014.00608. eCollection 2014.

Salicylic acid modulates levels of phosphoinositide dependent-phospholipase C substrates and products to remodel the Arabidopsis suspension cell transcriptome

Affiliations

Salicylic acid modulates levels of phosphoinositide dependent-phospholipase C substrates and products to remodel the Arabidopsis suspension cell transcriptome

Eric Ruelland et al. Front Plant Sci. .

Erratum in

Abstract

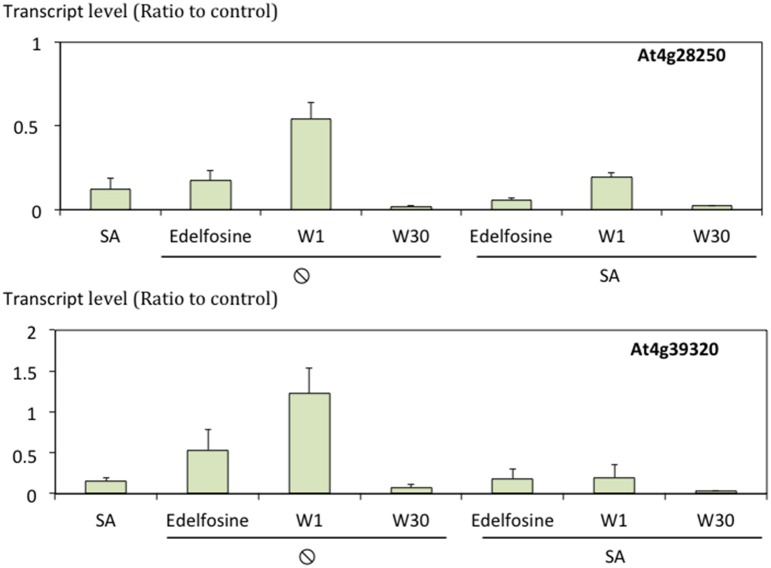
Basal phosphoinositide-dependent phospholipase C (PI-PLC) activity controls gene expression in Arabidopsis suspension cells and seedlings. PI-PLC catalyzes the production of phosphorylated inositol and diacylglycerol (DAG) from phosphoinositides. It is not known how PI-PLC regulates the transcriptome although the action of DAG-kinase (DGK) on DAG immediately downstream from PI-PLC is responsible for some of the regulation. We previously established a list of genes whose expression is affected in the presence of PI-PLC inhibitors. Here this list of genes was used as a signature in similarity searches of curated plant hormone response transcriptome data. The strongest correlations obtained with the inhibited PI-PLC signature were with salicylic acid (SA) treatments. We confirm here that in Arabidopsis suspension cells SA treatment leads to an increase in phosphoinositides, then demonstrate that SA leads to a significant 20% decrease in phosphatidic acid, indicative of a decrease in PI-PLC products. Previous sets of microarray data were re-assessed. The SA response of one set of genes was dependent on phosphoinositides. Alterations in the levels of a second set of genes, mostly SA-repressed genes, could be related to decreases in PI-PLC products that occur in response to SA action. Together, the two groups of genes comprise at least 40% of all SA-responsive genes. Overall these two groups of genes are distinct in the functional categories of the proteins they encode, their promoter cis-elements and their regulation by DGK or phospholipase D. SA-regulated genes dependent on phosphoinositides are typical SA response genes while those with an SA response that is possibly dependent on PI-PLC products are less SA-specific. We propose a model in which SA inhibits PI-PLC activity and alters levels of PI-PLC products and substrates, thereby regulating gene expression divergently.

Keywords: Arabidopsis; diacylglycerol kinase; hormone transduction; lipid signaling; phospholipase C; salicylic acid; trancriptomic.


Figures

Figure 1
Figure 1
Similarity between the edelfosine-responsive transcriptome and public transcriptome data. The 200 genes the most up-regulated by edelfosine and the 200 genes the most down-regulated by edelfosine were used as a signature to search for experiments with similar transcriptome changes. A similarity score, derived from Euclidean distance, was calculated by Genevestigator (Hruz et al., 2008) between the edelfosine signature and each experiment of a set. Then a relative similarity score was calculated where a relative similarity score of 1 stands for a similarity between the input signature and an experiment that is the same as the average over all experiments of a set. (A) The similarity search was performed against the 734 experiments under the “hormone” classification. (B) The similarity search was performed against 155 SA-response experiments (GEO ID: AT_00494, AT_00557, and AT_00339). The relative similarity scores between our signature input and a particular experiment will be different in (A,B) because the overall sets of experiments are different.
Figure 2
Figure 2
SA effects on radioactively labeled phospholipids. Cells were treated with 250 μM SA. Labeling was initiated 15 min before lipid extraction. Lipids were extracted and separated by TLC. (A) Amount of radioactivity incorporated into phosphoinositides relative to PI expressed as % of the control without SA. (B) Amount of radioactivity incorporated into PA relative to the sum of PC and PE expressed as % of the control without SA. *Indicates a value statistically different from time 0 (t-test, p-value < 0.05).
Figure 3
Figure 3
Working model of the action of PI-PLC substrates and products on SA-triggered gene expression. The action of PI-PLC substrates and products on gene expression is represented either by an arrow (positive action) or a line with a bar (negative action). The clusters of genes induced after SA treatment are represented in red and those inhibited in green.
Figure 4
Figure 4
Identification of genes whose expression characteristics are consistent with the clusters defined in Figure 3. Cluster A and B genes are SA-induced genes (A) while clusters C and D genes are SA-repressed genes (B).
Figure 5
Figure 5
Representation of genes of cluster A, B, C, and D according to their expression in response to SA, to edelfosine, to W30 and to W30 in the presence of SA (SAW30). Red blocks indicate relative higher transcript levels in the condition written in red at the top of the table (versus that written in green); green blocks indicate higher transcript levels in the conditions written green at the top of the table (versus that written in red) and black blocks indicate no significant difference in transcript levels between both conditions. Note that clusters BE and CE and clusters BW30 and CW30 are also represented here. Clusters BE and BW30 are the genes that would belong to cluster B if we had considered that a basal inhibiting effect of either edelfosine or W30 respectively was sufficient for a gene to be classed as cluster B. Clusters CE and CW30 are the genes that would belong to cluster B if we had considered that a basal inhibiting effect of either edelfosine or W30 respectively was sufficient for a gene to be classed as cluster C. These clusters are mentioned in Discussion.
Figure 6
Figure 6
Comparison of the clustering result according to the use of edelfosine or U73122 as the PI-PLC inhibitor. Red blocks indicate relative higher transcript levels in the condition written in red at the top of the table (versus that written in green); green blocks indicate higher transcript levels in the conditions written green at the top of the table (versus that written in red) and black blocks indicate no significant difference in transcript levels between both conditions. Stringent clusters were defined from this analysis.
Figure 7
Figure 7
Transcript levels of At4g28250 and At4g39320 in response to SA and/or lipid signaling inhibitors. Transcript levels were quantified by qPCR, normalized to actine transcript level and expressed relative to levels in control cells. n = 3.
Figure 8
Figure 8
Categorization of all SA-induced genes, cluster A genes and cluster B genes according to the molecular functions (A), Biological processes (B) and Cellular components (C) they are associated with. The data are normalized to category frequencies in the Arabidopsis genome dataset. The mean and SD for 100 bootstraps of the input were calculated. For cellular component analysis, two scales are used for clarity.
Figure 9
Figure 9
Categorization of all SA-repressed genes, cluster C genes and cluster D genes according to the molecular functions (A), Biological processes (B) and Cellular components (C) they are associated with. The data are normalized to category frequencies in the Arabidopsis genome dataset. The mean and SD for 100 bootstraps of the input were calculated. For cellular component analysis, two scales are used for clarity.
Figure 10
Figure 10
Motifs over-represented in clusters A, B and C, D compared to whole genome promoter set. Sequences of promoter regions were analyzed for 4- to 10-bp motifs over-represented in genes of the cluster vs. the whole genome set (p-value < 10−5; Chi-squared test). Among the motifs thus obtained a search for described cis-acting elements was performed. *, cis-acting element is located on reverse strand; M, A or C; Y, C or T. Cis-acting element is over-represented compared to the bulk list of SA-induced genes. The sizes of the nucleotide symbols indicate their frequency in the corresponding sequence.
Figure 11
Figure 11
Similarity between the SA responses of cluster A, B, C, and D and archived Arabidopsis transcriptomes in public databases. (A) Top 10 similar experiments retrieved using the response to SA of cluster A or cluster B genes as a signature. (B) Top 10 similar experiments retrieved using the response to SA of cluster C or cluster D genes as a signature. (C) Top 10 similar experiments retrieved using, as a signature, the response to SA of a list of genes composed of cluster B and C. The similarity search was performed using the Genevestigator signature module. An Euclidean distance-derived similarity score was calculated between our signature and each experiment of a set. A relative similarity score was calculated where a relative similarity score of 1 stands for a similarity between the input signature and an experiment that is the same as the average over all experiments of the set.
Figure 12
Figure 12
Crosstalk in gene expression in response to SA and PI-PLC dependency as defined by the clusters and dependency on PLD activity. The analysis was performed using stringent clusters as defined in the main text. Red blocks indicate relative higher transcript levels in the condition written in red at the top of the table (versus that written in green); green blocks indicate higher transcript levels in the conditions written green at the top of the table (versus that written in red) and black blocks indicate no significant difference in transcript levels between both conditions.
Figure 13
Figure 13
Classification of the genes of the different clusters according to their response to DGK inhibitor R59022. The analysis was performed using stringent clusters as defined in the main text. Red blocks indicate relative higher transcript levels in the condition written in red at the top of the table (versus that written in green); green blocks indicate higher transcript levels in the conditions written green at the top of the table (versus that written in red) and black blocks indicate no significant difference in transcript levels between both conditions.

References

    1. Achard P., Genschik P. (2008). Releasing the brakes of plant growth: how GAs shutdown DELLA proteins. J. Exp. Bot. 60, 1085–1092. 10.1093/jxb/ern301 - DOI - PubMed
    1. Altuzar-Molina A. R., Armando Munoz-Sanchez J., Vazquez-Flota F., Monforte-Gonzalez M., Racagni-Di Palma G., Teresa Hernandez-Sotomayor S. M. (2011). Phospholipidic signaling and vanillin production in response to salicylic acid and methyl jasmonate in Capsicum chinense. Plant Physiol. Biochem. 49, 151–158. 10.1016/j.plaphy.2010.11.005 - DOI - PubMed
    1. Boggs K. P., Rock C. O., Jackowski S. (1995). Lysophosphatidylcholine and 1-O-octadecyl-2-O-methyl-rac-glycero-3-phosphocholine inhibit the CDP-choline pathway of phosphatidylcholine synthesis at the CTP:phosphocholine cytidylyltransferase step. J. Biol. Chem. 270, 7757–7764. - PubMed
    1. Bowling S. A., Clarke J. D., Liu Y., Klessig D. F., Dong X. (1997). The cpr5 mutant of Arabidopsis expresses both NPR1-dependent and NPR1-independent resistance. Plant Cell 9, 1573–1584. - PMC - PubMed
    1. Bowling S. A., Guo A., Cao H., Gordon A. S., Klessig D. F., Dong X. I. (1994). A mutation in arabidopsis that leads to constitutive expression of systemic acquired-resistance. Plant Cell 6, 1845–1857. - PMC - PubMed