. 2014 Oct 1;5(11):3765-80.
doi: 10.1364/BOE.5.003765. eCollection 2014 Nov 1.

Effect of irradiation distance on image contrast in epi-optoacoustic imaging of human volunteers

Affiliations

Effect of irradiation distance on image contrast in epi-optoacoustic imaging of human volunteers

Gerrit Held et al. Biomed Opt Express. .

Abstract

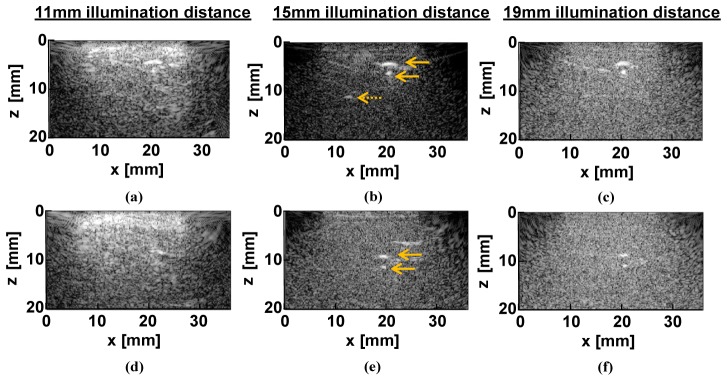
In combined clinical optoacoustic (OA) and ultrasound (US) imaging, epi-mode irradiation and detection integrated into one single probe offers flexible imaging of the human body. The imaging depth in epi-illumination is, however, strongly affected by clutter. As shown in previous phantom experiments, the location of irradiation plays an important role in clutter generation. We investigated the influence of the irradiation geometry on the local image contrast of clinical images, by varying the separation distance between the irradiated area and the acoustic imaging plane of a linear ultrasound transducer in an automated scanning setup. The results for different volunteers show that the image contrast can be enhanced on average by 25% and locally by more than a factor of two, when the irradiated area is slightly separated from the probe. Our findings have an important impact on the design of future optoacoustic probes for clinical application.

Keywords: (170.3880) Medical and biological imaging; (170.5120) Photoacoustic imaging; (170.7170) Ultrasound.


Figures

Fig. 1
Fig. 1
(a) Automated scanning setup for US and OA imaging, (b) Scan region with anatomical map of forearm vasculature. Anatomical structures are shown: radial artery (ar), the median nerve (nm) and the radial veins (vr). Position 1 and 2 marks the position the images of Fig. 2(a) and 2(b), respectively were taken.
Fig. 2
Fig. 2
(a) Transversal OA image at the position 1 indicated in Fig. 1(b). (b) Transversal OA image at position 2. (c) Superposition of OA (in color) and B-mode US at position 1.
Fig. 3
Fig. 3
OA transversal images indicating the influence of different irradiation distances on the image contrast at two different forearm positions, (a)-(c) and (d)-(f), of the same volunteer. The distance between the two positions was 3 cm; the solid arrows indicate the upper and lower wall of the radial artery; the dashed arrow indicates the median artery.
Fig. 4
Fig. 4
Maximum intensity projection in x-direction of OA images of two different volunteers, (a)-(c) and (d)-(f), respectively, at irradiation distances of 11 mm, 15 mm, and 19 mm; the solid arrows indicate the lower vessel wall of the radial artery; the dashed arrows show the outlines of the median artery;
Fig. 5
Fig. 5
Example of the definition of the ROI for contrast analysis around the lower vessel wall of the radial artery.
Fig. 6
Fig. 6
Signal and background analysis of the ROI around the lower vessel wall (indicated in Fig. 5) as a function of the imaging position y for different illumination distances for the same volunteer as shown in Fig. 4(a)-4(c); points correspond to measured data; blue solid lines indicate the moving-average of the signal level (lower vessel wall). The red dashed lines describe the moving average of the background level and the black dashed lines represent the noise level.
Fig. 7
Fig. 7
Local signal-to-background ratio [dB] inside the ROI (indicated in Fig. 5) as function of imaging position y, for two different volunteers, (a) and (b), (same volunteers as shown in Fig. 4(a)-4(c) and 4(d)-4(f)) and three irradiation distances (11 mm = blue, 15 mm = red and 19 mm = black). The scattered points correspond to raw data; lines show the moving average of the raw data. The horizontal lines indicate the average signal-to-background ratio over the entire scanning region.
Fig. 8
Fig. 8
Maximum intensity projection in x-direction of OA images for different irradiation distances varying from 11mm to 21mm with a step size of 2mm. The solid arrows indicate the lower vessel wall of the radial artery and the dashed arrow points at the median artery.
Fig. 9
Fig. 9
Bar plot showing the average and the standard deviation of the contrast of the lower radial artery wall (indicated by solid arrows in Fig. 8) for various irradiation distances. All values are expressed relative to the closest irradiation distance of 11mm.
Fig. 10
Fig. 10
Maximum intensity projection in x-direction of OA images for different irradiation distances varying from 0mm to 18mm; for an irradiation below the transducer aperture a transparent water bag was used as spacer, leading to a spacing of around 10mm between skin surface and transducer aperture; the dashed line in (a) indicates the skin surface; the solid arrow shows the upper vessel wall of the radial artery at a depth of 7-8mm inside the tissue.
Fig. 11
Fig. 11
Bar plot showing the average and the standard deviation of the contrast of the upper radial artery wall (indicated by a solid arrow in Fig. 10) for various irradiation distances. All values are expressed relative to the reference irradiation distance of 0mm (irradiation below transducer).
Fig. 12
Fig. 12
Monte Carlo simulation results for three different illumination angles. The optical properties chosen for the two layered forearm model are: n = 1.32, μa = 0.02 mm−1, μs’ = 1.0 mm−1, g = 0.9 for skin and n = 1.32, μa = 0.05 mm−1, μs’ = 0.45 mm−1, g = 0.93 for muscle tissue. The inclination of the light source becomes irrelevant after 7-8 millimeters, where the diffusion regime is reached.

References

    1. Beard P., “Biomedical photoacoustic imaging,” Interface Focus 1(4), 602–631 (2011).10.1098/rsfs.2011.0028 - DOI - PMC - PubMed
    1. Xu M., Wang L. V., “Photoacoustic imaging in biomedicine,” Rev. Sci. Instrum. 77(4), 041101 (2006).10.1063/1.2195024 - DOI
    1. Wang X., Xie X., Ku G., Wang L. V., Stoica G., “Noninvasive imaging of hemoglobin concentration and oxygenation in the rat brain using high-resolution photoacoustic tomography,” J. Biomed. Opt. 11(2), 024015 (2006).10.1117/1.2192804 - DOI - PubMed
    1. Zhang H. F., Maslov K., Stoica G., Wang L. V., “Functional photoacoustic microscopy for high-resolution and noninvasive in vivo imaging,” Nat. Biotechnol. 24(7), 848–851 (2006).10.1038/nbt1220 - DOI - PubMed
    1. Hu S., Wang L. V., “Photoacoustic imaging and characterization of the microvasculature,” J. Biomed. Opt. 15(1), 011101 (2010).10.1117/1.3281673 - DOI - PMC - PubMed