

Spatially explicit trends in the global conservation status of vertebrates
- PMID: 25426636
- PMCID: PMC4245261
- DOI: 10.1371/journal.pone.0113934
Spatially explicit trends in the global conservation status of vertebrates
Erratum in
-
Correction: spatially explicit trends in the global conservation status of vertebrates.PLoS One. 2015 Mar 20;10(3):e0121040. doi: 10.1371/journal.pone.0121040. eCollection 2015. PLoS One. 2015. PMID: 25793761 Free PMC article. No abstract available.
Abstract
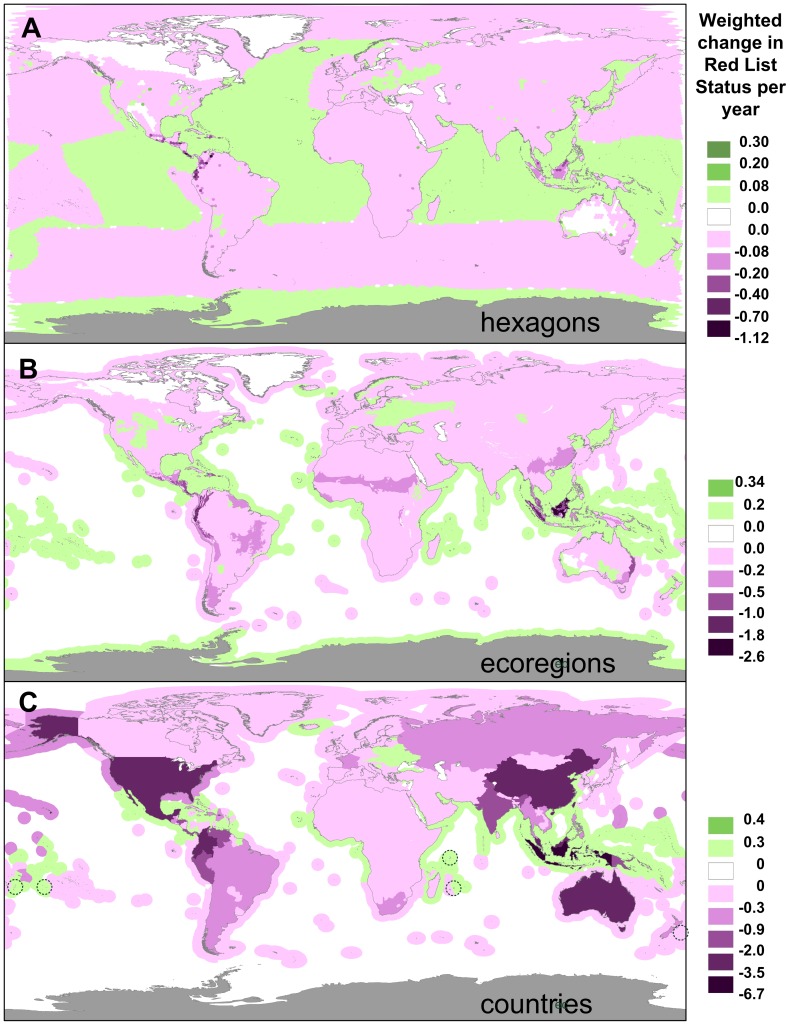
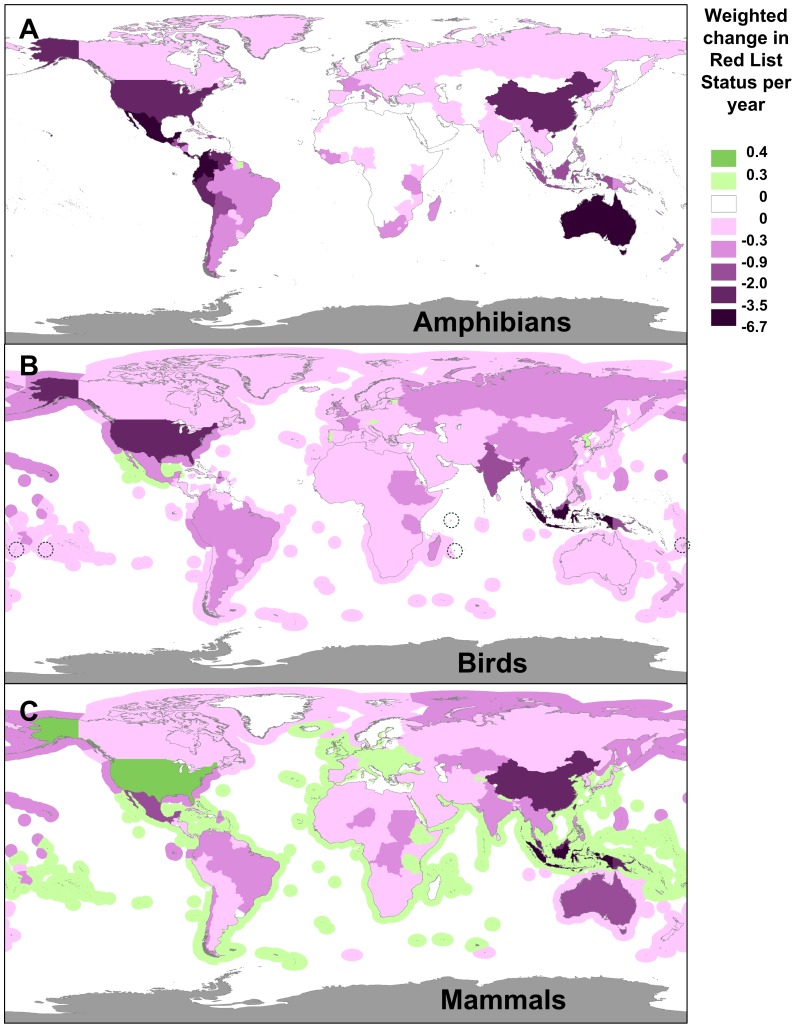
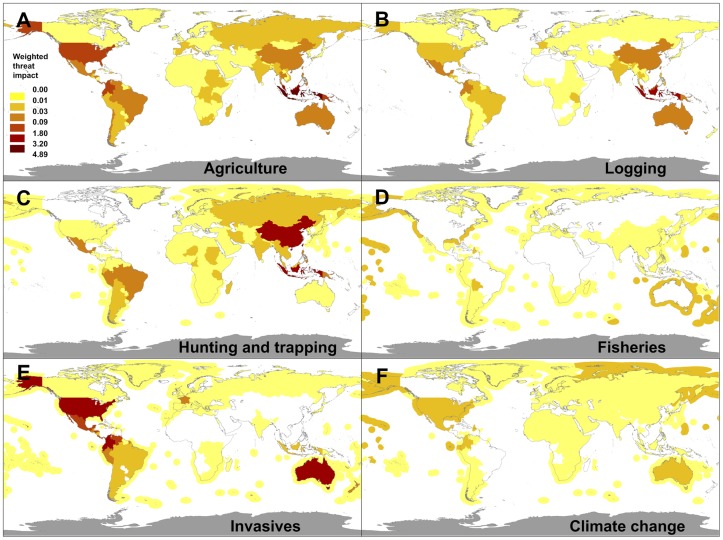
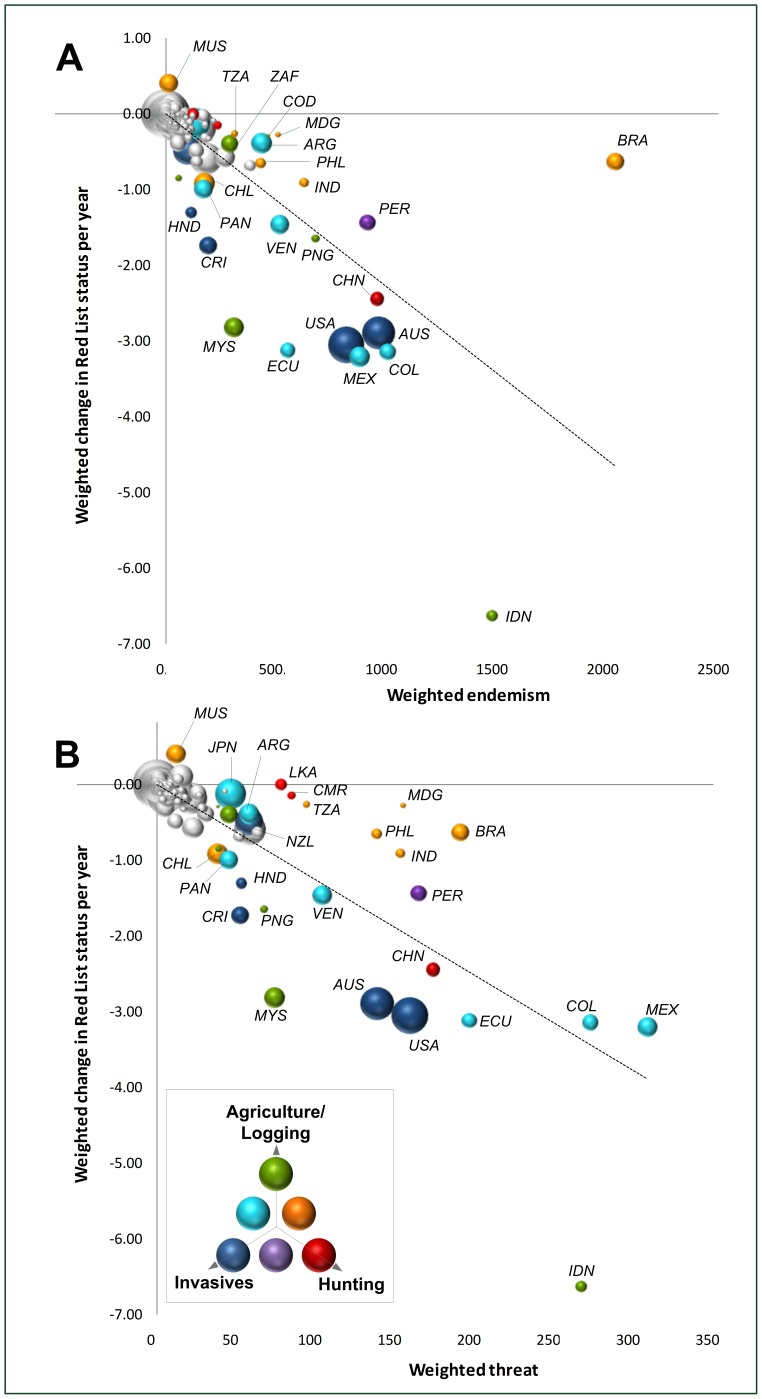
The world's governments have committed to preventing the extinction of threatened species and improving their conservation status by 2020. However, biodiversity is not evenly distributed across space, and neither are the drivers of its decline, and so different regions face very different challenges. Here, we quantify the contribution of regions and countries towards recent global trends in vertebrate conservation status (as measured by the Red List Index), to guide action towards the 2020 target. We found that>50% of the global deterioration in the conservation status of birds, mammals and amphibians is concentrated in <1% of the surface area, 39/1098 ecoregions (4%) and eight/195 countries (4%) - Australia, China, Colombia, Ecuador, Indonesia, Malaysia, Mexico, and the United States. These countries hold a third of global diversity in these vertebrate groups, partially explaining why they concentrate most of the losses. Yet, other megadiverse countries - most notably Brazil (responsible for 10% of species but just 1% of deterioration), plus India and Madagascar - performed better in conserving their share of global vertebrate diversity. Very few countries, mostly island nations (e.g. Cook Islands, Fiji, Mauritius, Seychelles, and Tonga), have achieved net improvements. Per capita wealth does not explain these patterns, with two of the richest countries - United States and Australia - fairing conspicuously poorly. Different countries were affected by different combinations of threats. Reducing global rates of biodiversity loss will require investment in the regions and countries with the highest responsibility for the world's biodiversity, focusing on conserving those species and areas most in peril and on reducing the drivers with the highest impacts.
Conflict of interest statement
Figures
References
-
- Convention on Biological Diversity (n.d.). Biodiversity Target. 2010. Available: http://www.cbd.int/2010-target/. Accessed 31 March 2010.
-
- Secretariat of the Convention on Biological Diversity. Strategic Plan for Biodiversity, 2011–2020. COP 10 Outcomes - Decisions (Advance Unedited Texts). Nagoya, Japan: Convention on Biological Diversity. 2010. Available: http://www.cbd.int/nagoya/outcomes/. Accessed 18 November 2010.
Publication types
MeSH terms
LinkOut - more resources
Full Text Sources
Other Literature Sources
