. 2014;10(12):2122-42.
doi: 10.4161/15548627.2014.981788.

Inhibition of autophagy as a new means of improving chemotherapy efficiency in high-LC3B triple-negative breast cancers

Affiliations

Inhibition of autophagy as a new means of improving chemotherapy efficiency in high-LC3B triple-negative breast cancers

Sylvain Lefort et al. Autophagy. 2014.

Abstract

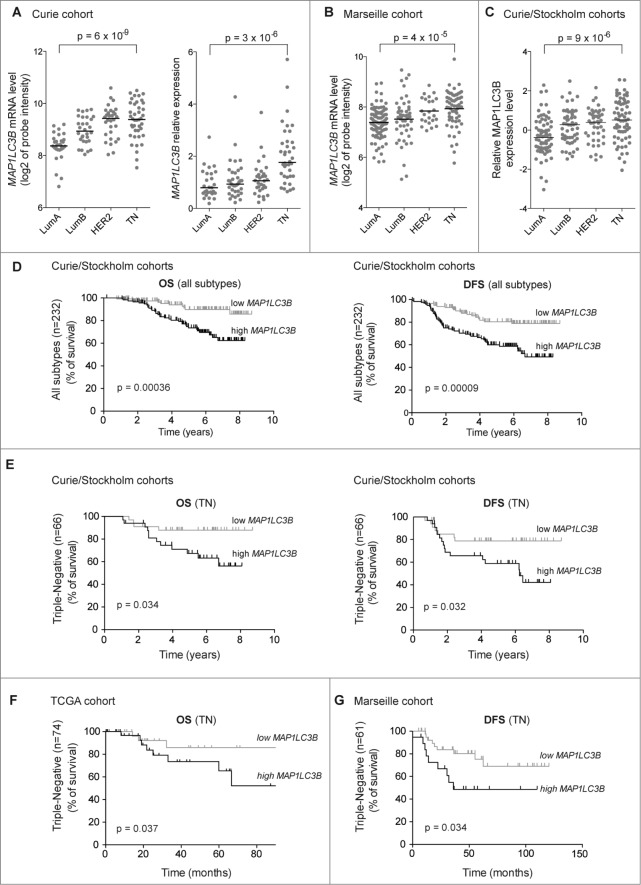
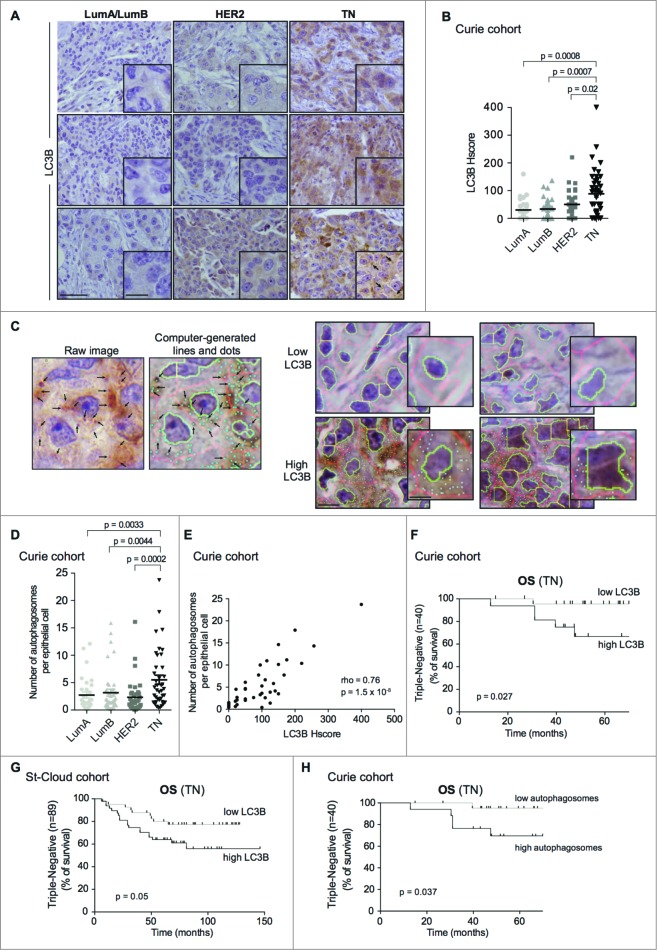
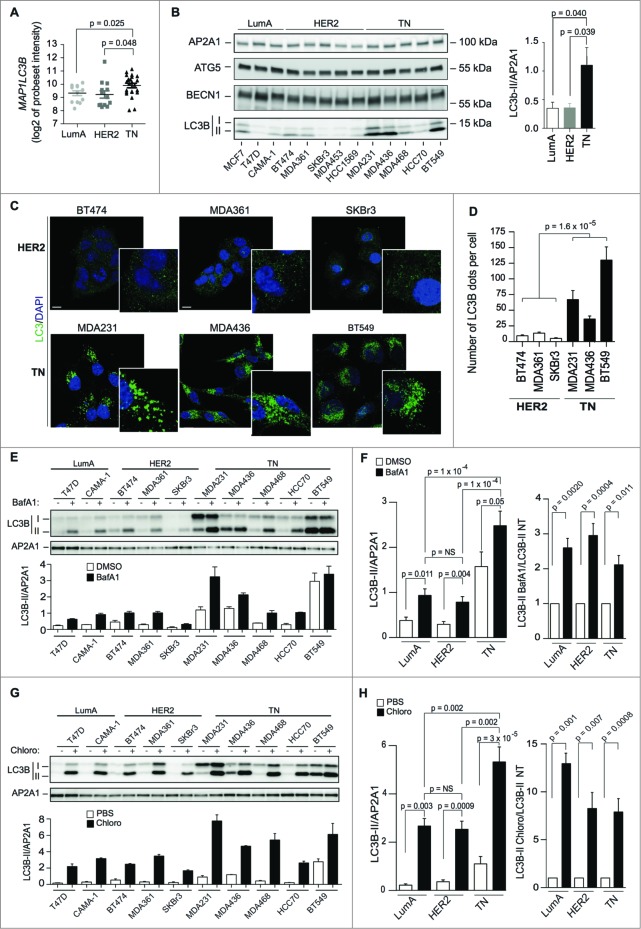
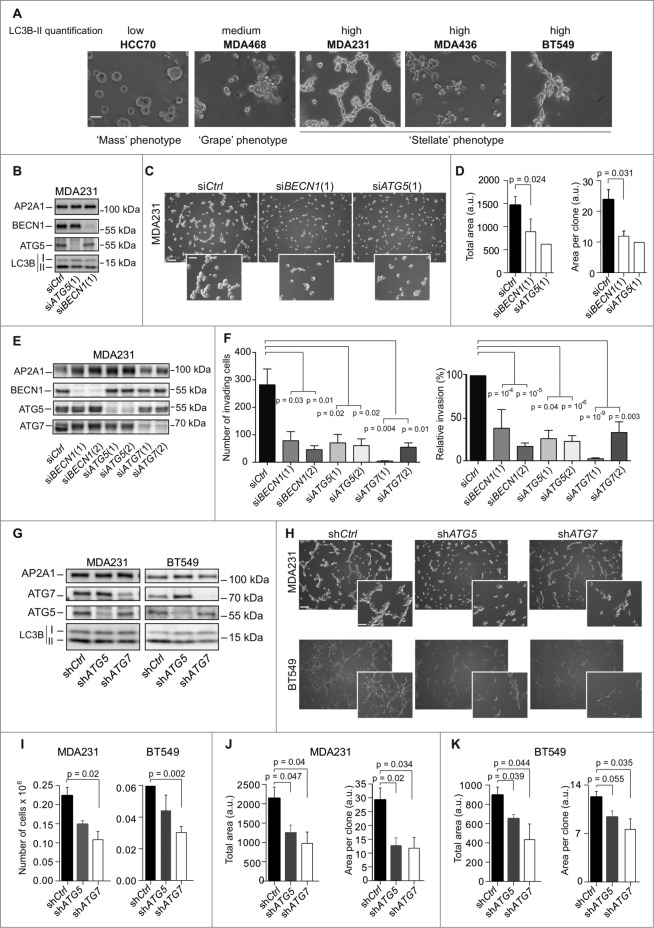
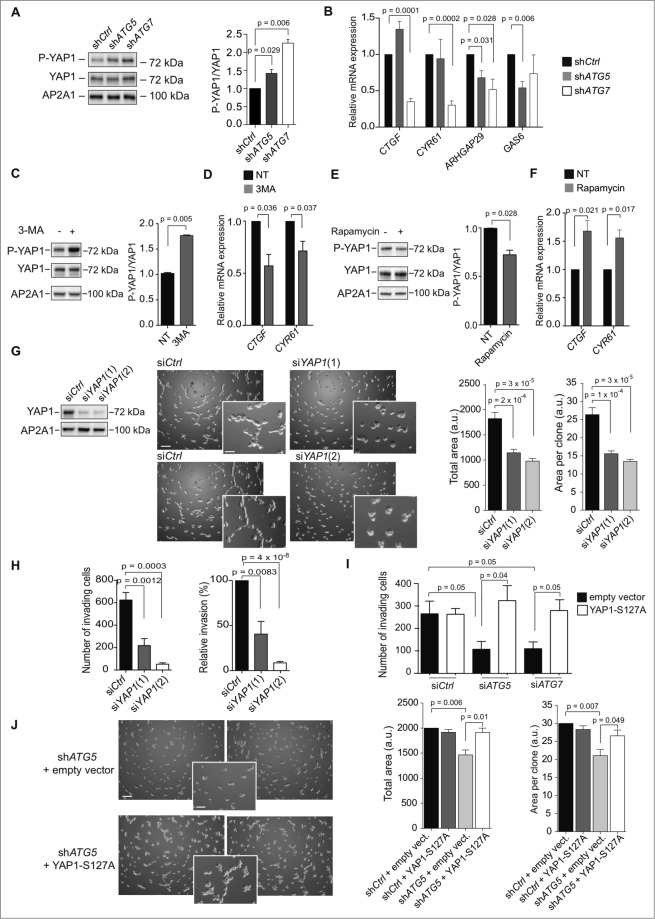
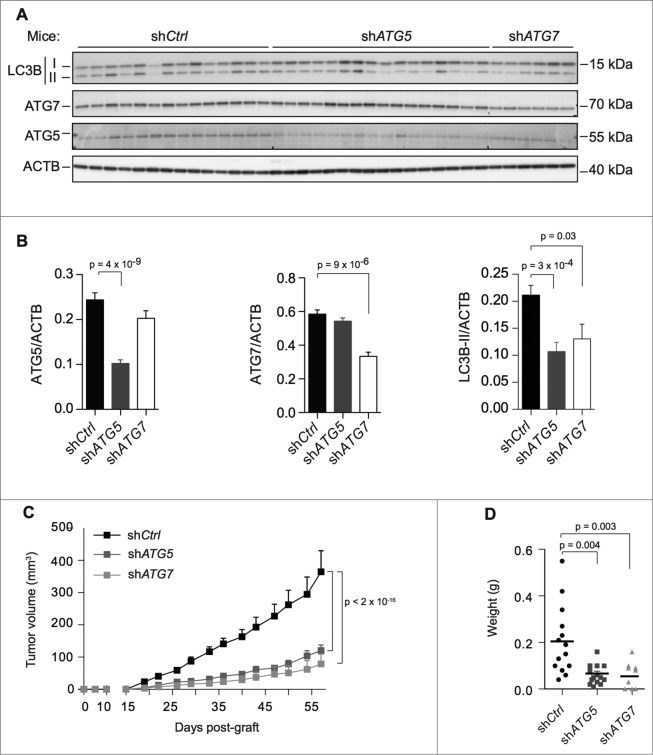
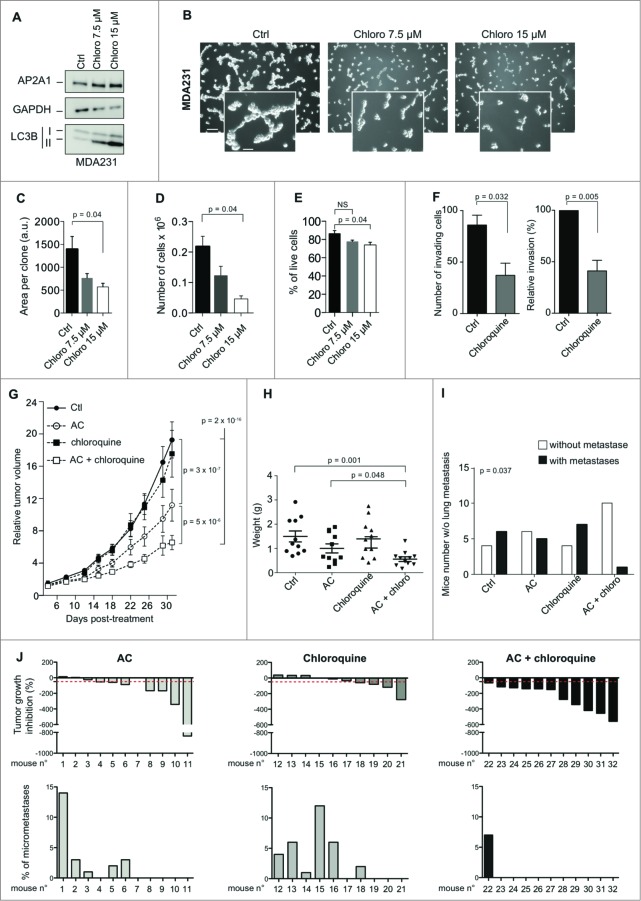
The triple-negative breast cancer (TN BC) subtype is the most aggressive form of invasive BC. Despite intensive efforts to improve BC treatments, patients with TN BC continue to exhibit poor survival, with half developing resistance to chemotherapy. Here we identify autophagy as a key mechanism in the progression and chemoresistance of a subset of TN tumors. We demonstrate that LC3B, a protein involved in autophagosome formation, is a reliable marker of poor prognosis in TN BC, validating this prognostic value at both the mRNA and protein levels in several independent cohorts. We also show that LC3B has no prognostic value for other BC subtypes (Luminal or HER2 BC), thus revealing a specific impact of autophagy on TN tumors. Autophagy is essential for the proliferative and invasive properties in 3D of TN BC cells characterized by high LC3B levels. Interestingly, the activity of the transcriptional co-activator YAP1 (Yes-associated protein 1) is regulated by the autophagy process and we identify YAP1 as a new actor in the autophagy-dependent proliferative and invasive properties of high-LC3B TN BC. Finally, inhibiting autophagy by silencing ATG5 or ATG7 significantly impaired high-LC3B TN tumor growth in vivo. Moreover, using a patient-derived TN tumor transplanted into mice, we show that an autophagy inhibitor, chloroquine, potentiates the effects of chemotherapeutic agents. Overall, our data identify LC3B as a new prognostic marker for TN BC and the inhibition of autophagy as a promising therapeutic strategy for TN BC patients.

Keywords: 3-dimensional culture; 3D, 3-dimensions; AC, adriamycin and cyclophosphamide; ACTB, actin, β; AP2A1/adaptin, adaptor-related protein complex 2, α 1 subunit; ATG, autophagy-related; BC, breast cancer; BECN1, Beclin 1, autophagy related; BafA1, bafilomycin A1; Ctrl, control; DFS, disease-free survival; EBSS, Earle's balanced salt solution; ERBB2/HER2, v-erb-b2 avian erythroblastic leukemia viral oncogene homolog 2; GAPDH, glyceraldehyde-3-phosphate dehydrogenase; HScore, histological scoring; IHC, immunohistochemistry; LC3B; Lum, Luminal; MAP1LC3B/LC3B, microtubule-associated protein one light chain 3 β; OS, overall survival; PDX, patient-derived xenografted tumor; TCGA, The Cancer Genome Atlas; TGI, tumor growth inhibition; TN BC, triple-negative breast cancer; YAP1; YAP1, Yes-associated protein 1; autophagy; breast cancers; i.p., intra-peritoneal; prognosis; response to treatment; sem, standard error of mean; three-MA, 3-methyladenine.


Figures

Figure 1.
Figure 1.
For figure legend, see page 2124. Figure 1 (See previous page). High levels of the MAP1LC3B mRNA are associated with poor prognosis in triple-negative BC. (A) Scatter plots of MAP1LC3B mRNA levels in Luminal A (LumA), Luminal B (LumB), HER2-enriched (HER2) and triple-negative (TN) BC subtypes from the Curie cohort. MAP1LC3B mRNA level was evaluated from Affymetrix U133 plus2.0 arrays (left panel, values are in log2 of probeset intensity) and by qRT-PCR (right panel, MAP1LC3B mRNA values are normalized relative to 3 housekeeping genes, TBP, RPLP0 and PPIA, see Materials and Methods). (B) Scatter plots of MAP1LC3B mRNA levels (expressed in log2 of probeset intensity) in LumA, LumB, HER2 and TN BC subtypes from the tumor micro-array dataset of Marseille cohort. (C) Scatter plots of MAP1LC3B mRNA levels in LumA, LumB, HER2 and TN BC subtypes in the combined Curie/Stockholm cohorts. Probeset intensities have been standardized (centered and reduced) to avoid batch effect (see Materials and Methods). (D,E) Kaplan-Meier curves of overall survival (OS) (left panel) and disease-free survival (right panel) for Curie/Stockholm cohorts, with respect to MAP1LC3B mRNA level, in (D) all subtypes of BC (N = 116 for low expression and N = 116 for high expression; cut-off value = 0.16, scatter plot shown in C), and (E) TN BC (N = 33 for low expression and n = 33 for high expression; cut-off value = 0.51, scatter plot shown in C). (F) Kaplan-Meier curves of OS for TCGA cohort, with respect to MAP1LC3B mRNA level, in TN BC (N = 37 for low expression and n = 37 for high expression; cut-off value = -0.22, scatter plot shown in Fig. S1). (G) Kaplan-Meier curves of DFS for Marseille cohort, with respect to MAP1LC3B mRNA level, in TN BC (N = 42 for low expression and N = 19 for high expression; cut-off value =8.34, scatter plot shown in B). p-values are based on the Student t test adjusted for multiple comparisons using Benjamini & Hochberg correction (A,C) or Log-rank test (D–G).
Figure 2.
Figure 2.
For figure legend, see page 2127. Figure 2 (See previous page). LC3B protein is a marker of poor prognosis in TN BC patients. (A) Representative views of LC3B immunostaining from Luminal A or B (LumA/LumB), HER2 and TN BC subtypes (Curie cohort). Black arrows point to examples of punctate LC3B immunostaining in TN BC sample. Scale bars = 50 μm (low magnification) and 20 μm (high magnification in inserted sections). (B) LC3B histological scoring (Hscore, see the Materials and Methods) among LumA, LumB, HER2 and TN BC subtypes (Curie cohort). (C) Representative views obtained before (raw data) or after treatment of LC3B IHC images with an automated image segmentation and quantification algorithm (Curie cohort, see the Materials and Methods). After computational analysis, autophagic vesicles are shown as blue dots. Nuclear and plasma membranes are in green and red, respectively. Low and high LC3B IHC are shown, as indicated. Scale bars = 20 μm (low magnification) and 10 μm (high magnification in inserted sections). (D) Scatter plot of average number of autophagosomes per epithelial cell in LumA, LumB, HER2 and TN BCs based on the quantification algorithm (Curie cohort). Horizontal bars represent the median values. (E) Correlation between LC3B histological score (Hscore) and the average number of autophagosomes per epithelial cell quantified by the algorithm. Correlation coefficient and p-value are based on Spearman's test. (F) Kaplan-Meier curve of OS for TN BC cases among Curie cohort, with respect to LC3B HScore (N = 24 for low expression and N = 16 for high expression; cut-off value = 100, scatter plot shown in B). (G) Kaplan-Meier curve of OS for TN BC cases among Saint-Cloud cohort with respect to LC3B HScore (N = 41 for low expression and N = 48 for high expression; cut-off value = 40, scatter plot shown in Fig. S4F). (H) Kaplan-Meier curve of OS of TN BC patients from the Curie cohort, with respect to the average number of autophagosomes per epithelial cell (N = 23 for low number and N = 17 for high number; cut-off value = 4.5, scatter plot shown in D). p-values are based on Mann-Whitney test (B,D) or Log-rank test (E,H).
Figure 3.
Figure 3.
For figure legend, see page 2129. Figure 3 (See previous page). TN cancer cell lines display high autophagy. (A) MAP1LC3B mRNA levels in LumA, HER2 and TN BC cell lines from the Affymetrix microarray. Horizontal bars represent the median values (N ≥ 10 cell lines in each BC subtype). p-values are based on the Student t test. (B) Representative protein gel blots showing LC3B-I/-II, BECN1, and ATG5 protein levels in LumA (MCF7, T47D, CAMA-one), HER2 (BT474, MDA361, SKBr3, MDA453, HCC1569) and TN (MDA231, MDA436, MDA468, HCC70, BT549) BC cell lines. AP2A1 is used as an internal control for protein loading. Bar graph (right panel) shows the ratio of LC3B-II/AP2A1 protein levels, as assessed by densitometric analysis of western blots. Data are shown as means +/− sem (N = 3 independent experiments). p-values are based on the Student t test. (C) Representative immunofluorescence staining from the indicated HER2 and TN BC cell lines, stained for LC3B (green) and DAPI (blue). Scale bar = 10 μm. (D) Bar graph represents the number of LC3B-positive dots per cell type (HER2 and TN cell lines are shown). Data are shown as means +/− sem (N ≥ 50 cells per condition). p-values are based on Student's t-test. (E–H) The indicated BC cells lines were treated either with (E,F) DMSO (−) and bafilomycin A1 (BafA1 [+], 200 nM for 4 h) or with (G,H) PBS [−] and chloroquine (Chloro [+], 50 μM, overnight). N = 3 independent experiments. (E,G) Representative protein gel blots for LC3B-I/-II protein levels and AP2A1 (used as internal control) are shown. Bar graphs (below each western blot) show the corresponding quantification of LC3B-II/AP2A1 protein level ratio, as assessed by densitometric analysis of protein gel blots, for each cell line, before and after treatment (white and black bars, respectively). (F,H) Bar graphs (left panels) show the ratio of LC3B-II/AP2A1 protein levels per BC subtype, considering LumA (T47D, CAMA-one), HER2 (BT474, MDA361, SKBr3, MDA453, HCC1569) and TN (MDA231, MDA436, MDA468, HCC70, BT549) BC cell lines and (right panels) the autophagy flux as the ratio of LC3B-II protein level after/before treatment (BafA1- or Chloro-treated/Untreated, NT). Data are shown as means +/− sem (N = 3 independent experiments). p-values are based on the Student t test.
Figure 4.
Figure 4.
For figure legend, see page 2131. Figure 4 (See previous page). High basal levels of autophagy support TN tumor-cell proliferation and invasion. (A) Representative bright field images from the indicated TN cell lines following 3 d of 3D culture. Scale bars = 100μm. (B-D) Results are from MDA231 TN cells transiently transfected with control- (Ctrl), BECN1- or ATG5-targeted siRNA. 48 h post-transfection, the cells were grown in 3D culture during 3 d, and maintained in 3D conditions for 3 d. (B) Western blots showing BECN1, ATG5 and LC3B-I/-II protein levels in MDA231 TN cells. AP2A1 is used as an internal control for protein loading. (C) Representative bright field images from MDA231 TN cells +/− siRNAs, as indicated. Scale bars = 100 μm (low magnification) and 50 μm (high magnification). (D) Bar graphs represent the total area covered by the stellate structures per field (left panel) (a total area of 0.85 mm2 has been evaluated; arbitrary unit, a.u) and the area per clone (right panel), as determined using Metamorph software. Data are from MDA231 TN cells +/− siRNAs, as indicated. Data show means +/− sem (N = 3 independent experiments). (E,F) Results shown are from a Transwell invasion assay using MDA231 TN cells transiently transfected with control- (Ctrl), BECN1-, ATG5- or ATG7-targeted siRNA for 72 h prior to the assay. (E) Western blots showing BECN1, ATG5, and ATG7 protein levels in MDA231 TN cells after transfection by the respective siRNA, prior to the Transwell assay. AP2A1 is used as an internal control for protein loading. (F) Invasion assay using a BioCoatTM MatrigelTM Invasion Chamber from autophagy-proficient (siCtl) or -deficient (siBECN1, siATG5, siATG7) MDA231 TN BC cells. Left histogram: Numbers of invading cells, which passed through the Transwell over 6 h of incubation. Right panel: Percentage of cells, relative to siCtrl (100%), which passed through the Transwell over 6 h of incubation. Data are shown as means +/− sem (N = 3 independent experiments). p-values are based on the Student t test. (G-K) Results are from MDA231 or BT549 cell lines stably expressing shRNA (referred to as shCtrl, shATG5 or shATG7) and cultured in 3D conditions. (G) Western blots show ATG7, ATG5, and LC3B protein levels in stable cell lines following 3D culture. AP2A1 is used as an internal control for protein loading. (H) Representative bright field images from MDA231 and BT549 TN cell lines stably expressing shRNAs, as indicated, following 3D culture. Scale bars = 100 μm (low magnification) and 50 μm (high magnification). (I) Bar graphs show the total number of cells extracted after 3 d of 3D culture. Results are from MDA231 and BT549 cell lines stably expressing shRNA (referred to as shCtrl, shATG5 or shATG7). Data are shown as means +/− sem (N = 3 independent experiments). (J,K) Bar graphs represent the total area of the stellate structures per field (left panel) or the area per clone (right panel). Data are shown as means +/− sem (N = 3 independent experiments) from stably silenced cell lines derived from MDA231 (H) or BT549 (I) cells. p-values are based on the Student t test.
Figure 5.
Figure 5.
For figure legend, see page 2133. Figure 5 (See previous page). The transcription co-activator YAP1 is a key player in the autophagy-dependent proliferation and invasion of TN BC cells. (A) Western blots showing phosphorylated-YAP1 (P-YAP1), YAP1, and AP2A1 proteins in stable cell lines following 3D culture. AP2A1 is used as internal control for protein loading. The bar graph (right panel) shows the corresponding quantification of P-YAP1/YAP1 protein level ratios. (B) mRNA levels of YAP1-target genes were monitored by RT-qPCR following 3D culture. GAPDH is used as an internal control for total mRNA expression. (C) Western blots (left) and corresponding quantification (bar graph, right) showing phosphorylated-YAP1 (P-YAP1), YAP1 and AP2A1 proteins in MDA231 cells cultured during 3 d in 3D and then either untreated (-) or treated with 3-methyladenine (3-MA; 20 mM) for 3 h. (D) mRNA levels of YAP1-target genes were monitored by RT-qPCR following 3-MA treatment. GAPDH is used as an internal control for total mRNA expression. (E) Western blots (left) and corresponding quantification (bar graph, right) showing phosphorylated-YAP1 (P-YAP1), YAP1 and AP2A1 proteins in MDA231 cells cultured during 3 d in 3D and then either untreated (-) or treated with rapamycin (2 μM) for 3 h. (F) mRNA levels of YAP1-target genes were monitored by RT-qPCR following rapamycin treatment. GAPDH is used as an internal control for total mRNA expression. (G) Left, western blots showing YAP1 protein levels in MDA231 cells after transfection with control- (siCtrl) or YAP1-targeted (siYAP1) siRNA. AP2A1 is used as an internal control for protein loading. Middle, representative bright field images from Control- or YAP1-depleted cells cultured in 3D, as indicated. Scale bars = 100 μm (low magnification) and 50 μm (high magnification). Right, the bar graphs represent the total area covered by the stellate structures per field (left panel) and the area per clone (right panel). Data are shown as means +/− sem (N = 3 independent experiments). p-values are based on the Student t test. (H) Invasion assay using a BioCoatTM MatrigelTM Invasion Chamber from MDA231 cells transiently transfected with control- (siCtrl) or YAP1-targeted (siYAP1) siRNA. for 72 h prior to the assay. Left histogram: Numbers of invading cells, which passed through a Transwell over 6 h of incubation. Right panel: Percentage of cells, relative to siCtrl (100%), which passed through a Transwell over 6 h of incubation. Data are shown as means +/− sem (N = 3 independent experiments). p-values are based on the Student t test. (I) Invasion assay using a BioCoatTM MatrigelTM Invasion Chamber from autophagy-deficient MDA231 cells (36 h of transfection with siATG7 or siATG5, as indicated), transfected again (36 h) with an empty vector or a vector expressing YAP1-S127A, a nonphosphorylable mutant form of YAP1. Numbers of invading cells, which passed through a Transwell over 6 h of incubation, are shown. Data are shown as means +/− sem (N = 3 independent experiments). p-values are based on the Student t test. (J) Results are from autophagy-proficient (shCtrl) or autophagy-deficient (shATG5) MDA231 cells, transfected with an empty vector or a vector expressing YAP1-S127A, after 3 d of 3D culture. Representative bright field images from ATG5-depleted cells expressing or not YAP1-S127A, as indicated. Scale bars = 100 μm (low magnification) and 50 μm (high magnification). Bar graphs represent the total area covered by the stellate structures per field (left panel) and the area per clone (right panel). Data are shown as means +/− sem (N = 5 independent experiments). P-values are based on the Student t test.
Figure 6.
Figure 6.
High basal levels of autophagy support TN tumorigenesis in mouse models. (A) Western blots showing LC3B-I/-II, ATG5 and ATG7 protein levels extracted from tumors of MDA231 cell lines stably expressing shCtrl, shATG5 or shATG7 and xenografted into mice. Each lane corresponds to an individual tumor (n ≥ 10 tumors analyzed per group. Note that 4 tumors did not develop at all in the ATG7-deficient condition). ACTB/β actin was used as an internal control for protein loading. (B) Corresponding quantification of the ratio of ATG5/ACTB, ATG7/ACTB or LC3B-II/ACTB protein levels in controls and ATG5- or ATG7-deficient tumors. Data are means +/− sem (N ≥ 10 per group). p-values are from the Student t test. (C) Tumor growth curves over time from xenografted MDA231 cell lines stably expressing shCtrl, shATG5 or shATG7, as indicated. Data presented are means +/− sem (N ≥ 10 per group). p-values are based on 2-way analysis of variance. (D) Graph shows the final weight of each tumor in each group. p-values are based on the Student t test.
Figure 7.
Figure 7.
For figure legend, see page 2136. Figure 7 (See previous page). Chloroquine potentiates chemotherapy in a PDX model of high-LC3B TN BC. (A) Western blots showing LC3B-I/-II protein levels in MDA231 TN BC cell line untreated (Ctrl) or treated for 3 d with 2 doses of chloroquine (Chloro; 7.5 or 15 μM), as indicated. AP2A1 and GAPDH are used as internal controls for protein loading. (B) Representative bright field images of MDA231 TN BC cells cultured in 3D conditions. Cells are either treated with PBS (Ctrl) or treated with 2 doses of chloroquine, as indicated. Scale bars = 100 μm, (low magnification) and 50 μm (high magnification). (C) The bar graph represents the total area per clone upon chloroquine treatment, as determined using Metamorph software. Data are shown as means +/− sem (N = 3 independent experiments). p-values are based on the Student t test. (D,E) Bar graphs show the total number of cells (D) and the percentage of live cells, as assessed by trypan blue-negative cells, (E) after 3 d of 3D culture. Results are from MDA231 cells either treated with PBS (Ctrl) or treated with 2 doses of chloroquine, as indicated. Data are shown as means +/− sem (N = 3 independent experiments). p-values are based on Student t test. (F) Invasion assay using a BioCoatTM MatrigelTM Invasion Chamber from MDA231 cells, either untreated (Ctl) or treated with (50 μM) of chloroquine overnight. Left histogram: Numbers of invading cells, which passed through a Transwell over 6 h of incubation. Right panel: Percentage of cells, relative to siCtrl (100%), which passed through a Transwell over 6 h of incubation. (G) Tumor growth curves over time of a high-LC3B PDX model. When tumors reached 50 mm3, mice were treated either with PBS (Ctrl), AC (adriamycin and cyclophosphamide), chloroquine, or a combination of AC and chloroquine, for 31 d. Relative tumor volumes are presented as means ± sem (N ≥ 10 mice per group). p-values are based on 2-way ANOVA test. (H) Graph shows the final weight of each tumor in each group (n ≥ 10 per group). p-values are based on the Student t test. (I) The bar graph shows the number of mice without (white) or with (black) lung metastases, as assessed by the detection of human-specific Alu sequences in RNA extracted from mouse lung. N ≥ 10 animals per condition. p-value is based on Fisher's exact test. (J) Upper Panel, tumor growth inhibition (defined as % of tumor volume before treatment) is shown for each mouse following AC treatment, administration of chloroquine alone or a combination of AC + chloroquine, as indicated. Lower Panel, quantification in each mouse of lung colonization by tumor cells. Lung colonization was quantified by the detection of human-specific Alu sequences. Lung metastases are quantified after 31 d of treatment with AC, chloroquine or AC + chloroquine, as indicated. N ≥ 10 tumors for each condition. Numbers below each graph represents the tag number of each mouse.

References

    1. Jemal A, Siegel R, Xu J, Ward E. Cancer statistics, 2010. CA Cancer J Clin 2010; 60:277-300; PMID:20610543; http://dx.doi.org/10.3322/caac.20073 - DOI - PubMed
    1. Ferlay J, Steliarova-Foucher E, Lortet-Tieulent J, Rosso S, Coebergh JWW, Comber H, Forman D, Bray F. Cancer incidence and mortality patterns in Europe: estimates for 40 countries in 2012. Eur J Cancer Oxf Engl 1990 2013; 49:1374-403 - PubMed
    1. Carey LA, Dees EC, Sawyer L, Gatti L, Moore DT, Collichio F, Ollila DW, Sartor CI, Graham ML, Perou CM. The triple negative paradox: primary tumor chemosensitivity of breast cancer subtypes. Clin Cancer Res Off J Am Assoc Cancer Res 2007; 13:2329-34; http://dx.doi.org/10.1158/1078-0432.CCR-06-1109 - DOI - PubMed
    1. Foulkes WD, Smith IE, Reis-Filho JS. Triple-negative breast cancer. N Engl J Med 2010; 363:1938-48; PMID:21067385; http://dx.doi.org/10.1056/NEJMra1001389 - DOI - PubMed
    1. Kennecke H, Yerushalmi R, Woods R, Cheang MCU, Voduc D, Speers CH, Nielsen TO, Gelmon K. Metastatic behavior of breast cancer subtypes. J Clin Oncol Off J Am Soc Clin Oncol 2010; 28:3271-7; http://dx.doi.org/10.1200/JCO.2009.25.9820 - DOI - PubMed

Publication types