

SOX1 down-regulates β-catenin and reverses malignant phenotype in nasopharyngeal carcinoma
- PMID: 25427424
- PMCID: PMC4326525
- DOI: 10.1186/1476-4598-13-257
SOX1 down-regulates β-catenin and reverses malignant phenotype in nasopharyngeal carcinoma
Abstract
Background: Aberrant activation of the Wnt/β-catenin signaling pathway is an important factor in the development of nasopharyngeal carcinoma (NPC). Previous studies have demonstrated that the developmental gene sex-determining region Y (SRY)-box 1 (SOX1) inhibits cervical and liver tumorigenesis by interfering with the Wnt/β-catenin signaling pathway. However, the role of SOX1 in NPC remains unclear. This study investigates the function of SOX1 in NPC pathogenesis.
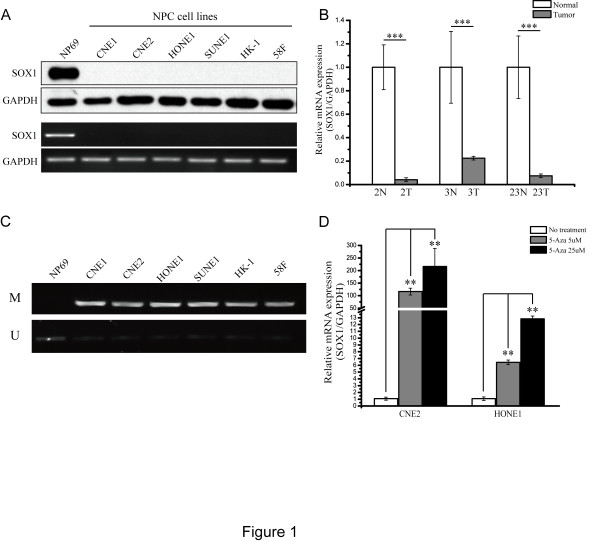
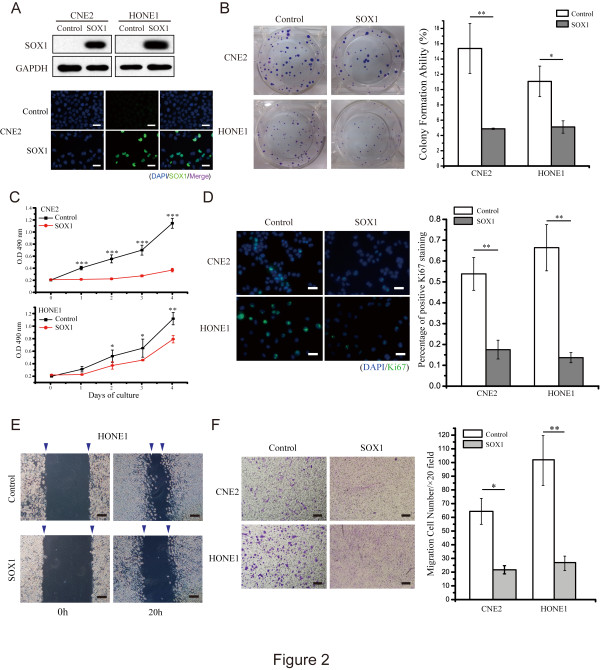
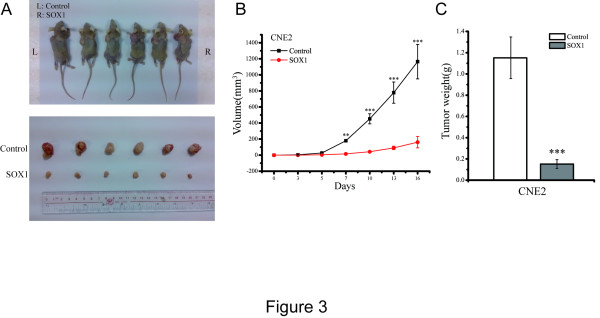
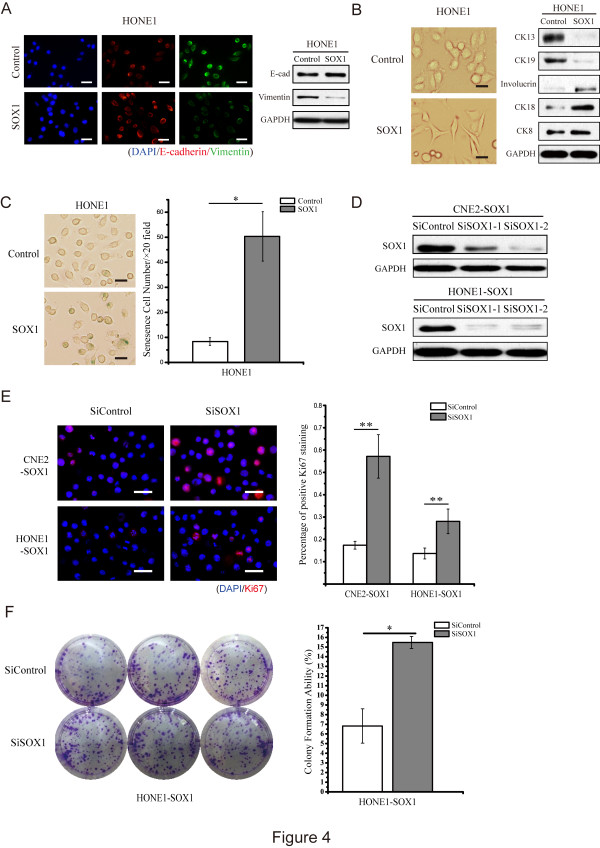
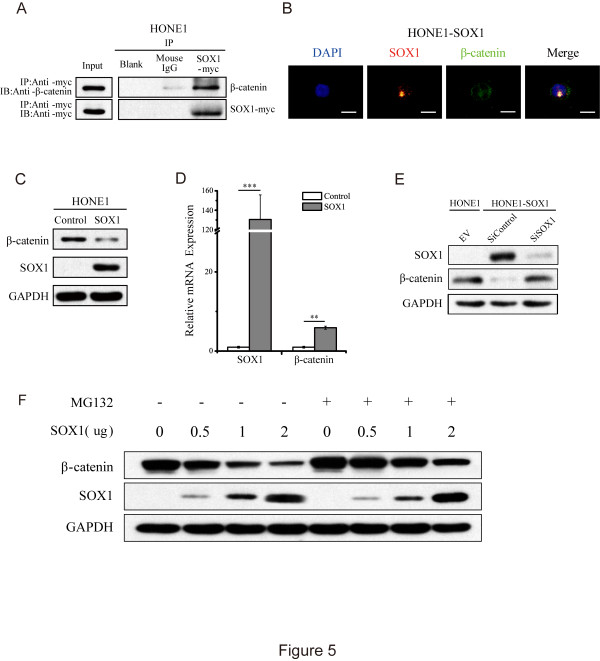
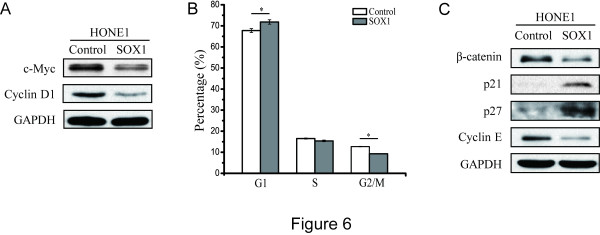
Results: Down-regulation of SOX1 was detected in NPC cell lines and tissues. Besides, quantitative methylation-specific polymerase chain reaction revealed that SOX1 promoter was hypermethylated in NPC cell lines. Ectopic expression of SOX1 in NPC cells suppressed colony formation, proliferation and migration in vitro and impaired tumor growth in nude mice. Restoration of SOX1 expression significantly reduced epithelial-mesenchymal transition, enhanced cell differentiation and induced cellular senescence. Conversely, transient knockdown of SOX1 by siRNA in these cells partially restored cell proliferation and colony formation. Notably, SOX1 was found to physically interact with β-catenin and reduce its expression independent of proteasomal activity, leading to inhibition of Wnt/β-catenin signaling and decreased expression of downstream target genes.
Conclusions: SOX1 decreases the expression of β-catenin in a proteasome-independent manner and reverses the malignant phenotype in NPC cells.
Figures
Similar articles
-
FEZF1-AS1 is a key regulator of cell cycle, epithelial-mesenchymal transition and Wnt/β-catenin signaling in nasopharyngeal carcinoma cells.Biosci Rep. 2019 Jan 8;39(1):BSR20180906. doi: 10.1042/BSR20180906. Print 2019 Jan 31. Biosci Rep. 2019. Retraction in: Biosci Rep. 2023 Jan 31;43(1):BSR-2018-0906_RET. doi: 10.1042/BSR-2018-0906_RET. PMID: 30355645 Free PMC article. Retracted.
-
SOX1 functions as a tumor suppressor by antagonizing the WNT/β-catenin signaling pathway in hepatocellular carcinoma.Hepatology. 2012 Dec;56(6):2277-87. doi: 10.1002/hep.25933. Hepatology. 2012. PMID: 22767186
-
MicroRNA-506 inhibits tumor growth and metastasis in nasopharyngeal carcinoma through the inactivation of the Wnt/β-catenin signaling pathway by down-regulating LHX2.J Exp Clin Cancer Res. 2019 Feb 21;38(1):97. doi: 10.1186/s13046-019-1023-4. J Exp Clin Cancer Res. 2019. Retraction in: J Exp Clin Cancer Res. 2021 Sep 30;40(1):309. doi: 10.1186/s13046-021-02113-3. PMID: 30791932 Free PMC article. Retracted. Clinical Trial.
-
Epigenetic disruption of cell signaling in nasopharyngeal carcinoma.Chin J Cancer. 2011 Apr;30(4):231-9. doi: 10.5732/cjc.011.10080. Chin J Cancer. 2011. PMID: 21439244 Free PMC article. Review.
-
SOX1 Is a Backup Gene for Brain Neurons and Glioma Stem Cell Protection and Proliferation.Mol Neurobiol. 2021 Jun;58(6):2634-2642. doi: 10.1007/s12035-020-02240-6. Epub 2021 Jan 22. Mol Neurobiol. 2021. PMID: 33481176 Review.
Cited by
-
Clinical Significance of SOX10 Expression in Human Pathology.Curr Issues Mol Biol. 2023 Dec 15;45(12):10131-10158. doi: 10.3390/cimb45120633. Curr Issues Mol Biol. 2023. PMID: 38132479 Free PMC article. Review.
-
Endothelial Arid1a deletion disrupts the balance among angiogenesis, neurogenesis and gliogenesis in the developing brain.Cell Prolif. 2023 May;56(5):e13447. doi: 10.1111/cpr.13447. Epub 2023 Mar 13. Cell Prolif. 2023. PMID: 36916004 Free PMC article.
-
FEZF1-AS1 is a key regulator of cell cycle, epithelial-mesenchymal transition and Wnt/β-catenin signaling in nasopharyngeal carcinoma cells.Biosci Rep. 2019 Jan 8;39(1):BSR20180906. doi: 10.1042/BSR20180906. Print 2019 Jan 31. Biosci Rep. 2019. Retraction in: Biosci Rep. 2023 Jan 31;43(1):BSR-2018-0906_RET. doi: 10.1042/BSR-2018-0906_RET. PMID: 30355645 Free PMC article. Retracted.
-
SEPT9_v2, frequently silenced by promoter hypermethylation, exerts anti-tumor functions through inactivation of Wnt/β-catenin signaling pathway via miR92b-3p/FZD10 in nasopharyngeal carcinoma cells.Clin Epigenetics. 2020 Mar 5;12(1):41. doi: 10.1186/s13148-020-00833-5. Clin Epigenetics. 2020. PMID: 32138771 Free PMC article.
-
Down-regulation of exosomal miR-200c derived from keratinocytes in vitiligo lesions suppresses melanogenesis.J Cell Mol Med. 2020 Oct;24(20):12164-12175. doi: 10.1111/jcmm.15864. Epub 2020 Sep 11. J Cell Mol Med. 2020. PMID: 32918341 Free PMC article.
References
Publication types
MeSH terms
Substances
LinkOut - more resources
Full Text Sources
Other Literature Sources
