. 2015 Feb 18;43(3):e19.
doi: 10.1093/nar/gku1211. Epub 2014 Nov 26.

BreaKmer: detection of structural variation in targeted massively parallel sequencing data using kmers

Affiliations

BreaKmer: detection of structural variation in targeted massively parallel sequencing data using kmers

Ryan P Abo et al. Nucleic Acids Res. .

Abstract

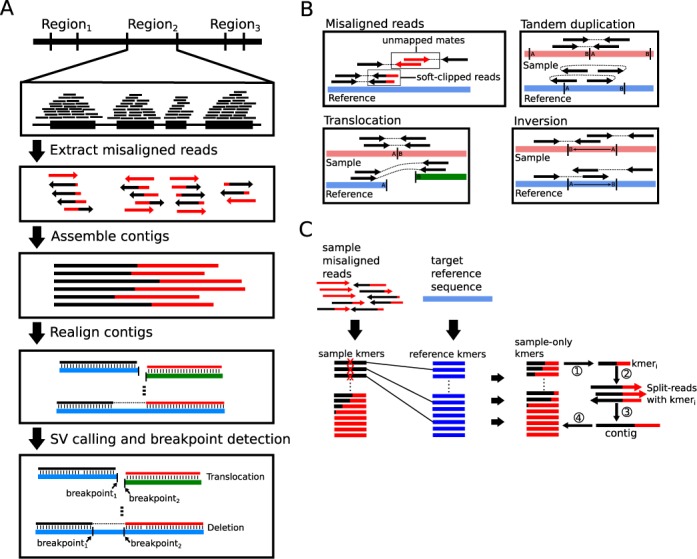
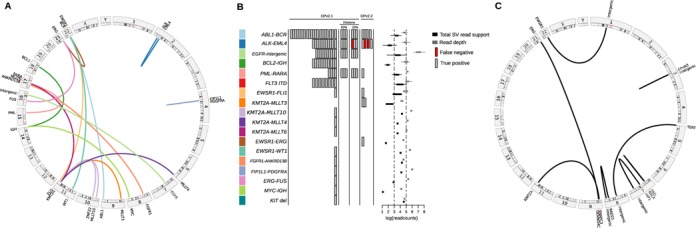
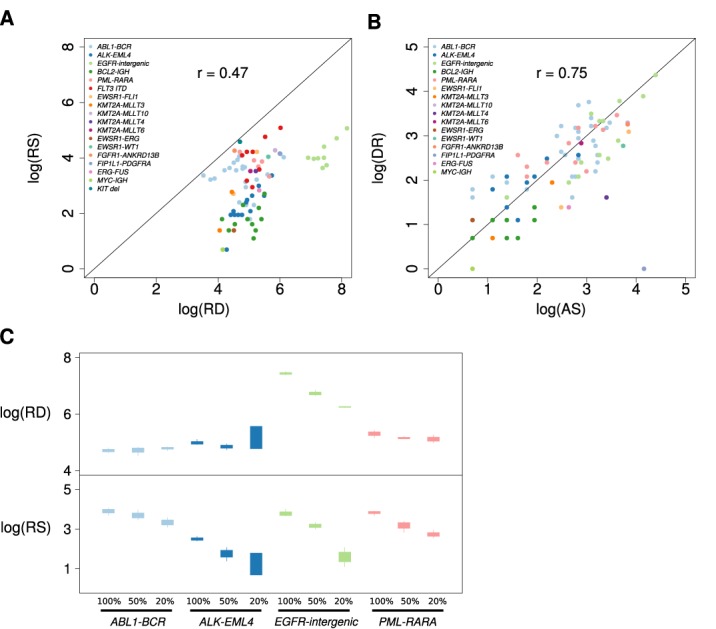
Genomic structural variation (SV), a common hallmark of cancer, has important predictive and therapeutic implications. However, accurately detecting SV using high-throughput sequencing data remains challenging, especially for 'targeted' resequencing efforts. This is critically important in the clinical setting where targeted resequencing is frequently being applied to rapidly assess clinically actionable mutations in tumor biopsies in a cost-effective manner. We present BreaKmer, a novel approach that uses a 'kmer' strategy to assemble misaligned sequence reads for predicting insertions, deletions, inversions, tandem duplications and translocations at base-pair resolution in targeted resequencing data. Variants are predicted by realigning an assembled consensus sequence created from sequence reads that were abnormally aligned to the reference genome. Using targeted resequencing data from tumor specimens with orthogonally validated SV, non-tumor samples and whole-genome sequencing data, BreaKmer had a 97.4% overall sensitivity for known events and predicted 17 positively validated, novel variants. Relative to four publically available algorithms, BreaKmer detected SV with increased sensitivity and limited calls in non-tumor samples, key features for variant analysis of tumor specimens in both the clinical and research settings.


Figures

Figure 1.
Figure 1.
(A) Algorithm workflow for a given target region. (B) Illustration of reads with ‘misaligned’ sequences that are soft-clipped by the alignment tool or paired-end reads with unmapped mates are extracted to use for building contigs. The locations of the discordantly mapped paired-end reads with signatures suggestive of inversions, tandem duplications and translocations are stored and used for downstream analysis and filtering. (C) BreaKmer assembly process using the kmer subtraction procedure to iteratively build contigs.
Figure 2.
Figure 2.
(A) A circos plot displaying links between gene partners and their genomic locations for the known translocations. (B) BreaKmer analysis results for the 38 cancer specimens and 80 ‘normal’ controls. For the 18 known SV events listed in the table rows, the true-positive (gray rectangle) and false-negative (red rectangle) results are shown for each replicate analyzed with the corresponding SV. The rectangles in the center are spaced to indicate separate samples. Boxplots on the right show the distributions of total read support (black boxplots) with the read depth (gray boxplots) at the inferred breakpoints for each of the known variants detected by BreaKmer. (C) A circos plot showing the validated novel translocation partners and their genomic locations identified by BreaKmer.
Figure 3.
Figure 3.
Plots displaying the relations between sequence read evidence and read depths. (A) A scatterplot showing the relation between the total read support (RS) for the known SV events identified from the BreaKmer analysis and the maximum sequence read depth (RD) observed at the inferred SV breakpoints on the log scale. Each point represents a replicate in which a true-positive call was made by BreaKmer, and the point color corresponds to the known SV of the sample replicate. (B) A scatterplot showing the relation between the quantity of the two types of sequence read evidence identified by BreaKmer for translocations. Each point represents a replicate with a known translocation that BreaKmer properly identified with the log transformed number of assembled reads (AS) on the x-axis and the log transformed number of discordantly mapped read pairs (DR) on the y-axis. (C) Boxplots showing the distributions of the BreaKmer inferred breakpoint read depth (RD, top panel) in relation to the amount of total read support (RS, bottom panel) of the identified known translocations for the four samples with tumor purity dilution replicates.

References

    1. Vogelstein B., Papadopoulos N., Velculescu V.E., Zhou S., Diaz L.A., Kinzler K.W. Cancer genome landscapes. Science. 2013;339:1546–1558. - PMC - PubMed
    1. Bunting S.F., Nussenzweig A. End-joining, translocations and cancer. Nat. Rev. Cancer. 2013;13:443–454. - PMC - PubMed
    1. Mitelman F., Johansson B., Mertens F. The impact of translocations and gene fusions on cancer causation. Nat. Rev. Cancer. 2007;7:233–245. - PubMed
    1. Rowley J.D. Chromosome translocations: dangerous liaisons revisited. Nat. Rev. Cancer. 2001;1:245–250. - PubMed
    1. Rowley J.D. Chromosomal translocations: revisited yet again. Blood. 2008;112:2183–2189. - PubMed

Publication types

Associated data