

Lethal coinfection of influenza virus and Streptococcus pneumoniae lowers antibody response to influenza virus in lung and reduces numbers of germinal center B cells, T follicular helper cells, and plasma cells in mediastinal lymph Node
- PMID: 25428873
- PMCID: PMC4338877
- DOI: 10.1128/JVI.02455-14
Lethal coinfection of influenza virus and Streptococcus pneumoniae lowers antibody response to influenza virus in lung and reduces numbers of germinal center B cells, T follicular helper cells, and plasma cells in mediastinal lymph Node
Abstract
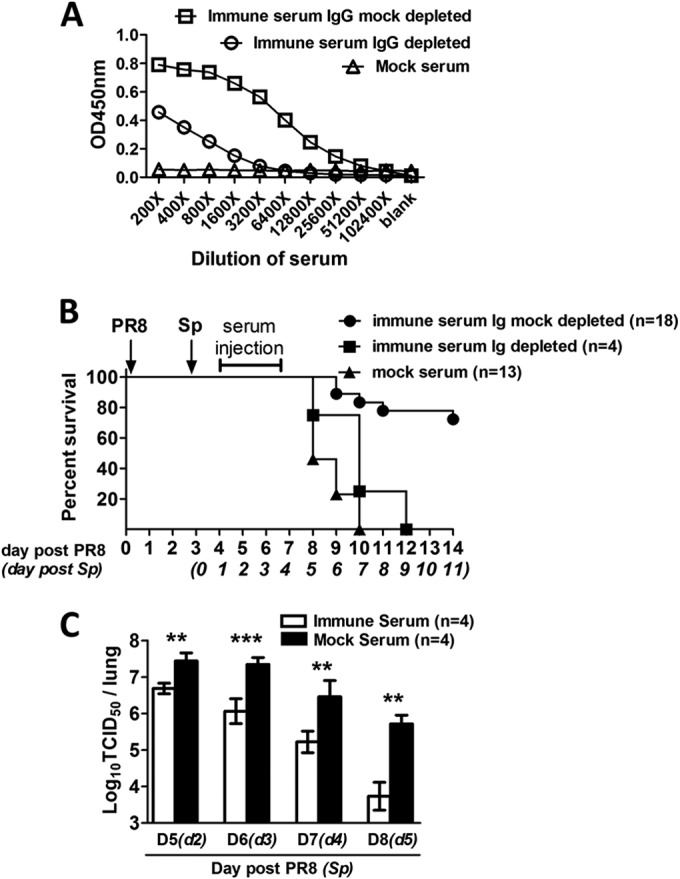
Secondary Streptococcus pneumoniae infection after influenza is a significant clinical complication resulting in morbidity and sometimes mortality. Prior influenza virus infection has been demonstrated to impair the macrophage and neutrophil response to the subsequent pneumococcal infection. In contrast, how a secondary pneumococcal infection after influenza can affect the adaptive immune response to the initial influenza virus infection is less well understood. Therefore, this study focuses on how secondary pneumococcal infection after influenza may impact the humoral immune response to the initial influenza virus infection in a lethal coinfection mouse model. Compared to mice infected with influenza virus alone, mice coinfected with influenza virus followed by pneumococcus had significant body weight loss and 100% mortality. In the lung, lethal coinfection significantly increased virus titers and bacterial cell counts and decreased the level of virus-specific IgG, IgM, and IgA, as well as the number of B cells, CD4 T cells, and plasma cells. Lethal coinfection significantly reduced the size and weight of spleen, as well as the number of B cells along the follicular developmental lineage. In mediastinal lymph nodes, lethal coinfection significantly decreased germinal center B cells, T follicular helper cells, and plasma cells. Adoptive transfer of influenza virus-specific immune serum to coinfected mice improved survival, suggesting the protective functions of anti-influenza virus antibodies. In conclusion, coinfection reduced the B cell response to influenza virus. This study helps us to understand the modulation of the B cell response to influenza virus during a lethal coinfection.
Importance: Secondary pneumococcal infection after influenza virus infection is an important clinical issue that often results in excess mortality. Since antibodies are key mediators of protection, this study aims to examine the antibody response to influenza virus and demonstrates that lethal coinfection reduced the B cell response to influenza virus. This study helps to highlight the complexity of the modulation of the B cell response in the context of coinfection.
Copyright © 2015, American Society for Microbiology. All Rights Reserved.
Figures


Similar articles
-
Coinfection with Streptococcus pneumoniae negatively modulates the size and composition of the ongoing influenza-specific CD8⁺ T cell response.J Immunol. 2014 Nov 15;193(10):5076-87. doi: 10.4049/jimmunol.1400529. Epub 2014 Oct 13. J Immunol. 2014. PMID: 25311807 Free PMC article.
-
Pulmonary immunostimulation with MALP-2 in influenza virus-infected mice increases survival after pneumococcal superinfection.Infect Immun. 2015 Dec;83(12):4617-29. doi: 10.1128/IAI.00948-15. Epub 2015 Sep 14. Infect Immun. 2015. PMID: 26371127 Free PMC article.
-
Therapeutic effects of garenoxacin in murine experimental secondary pneumonia by Streptococcus pneumoniae after influenza virus infection.Diagn Microbiol Infect Dis. 2014 Feb;78(2):168-71. doi: 10.1016/j.diagmicrobio.2013.11.003. Epub 2013 Nov 14. Diagn Microbiol Infect Dis. 2014. PMID: 24321356
-
Interactions between Streptococcus pneumoniae and influenza virus: a mutually beneficial relationship?Future Microbiol. 2012 May;7(5):609-24. doi: 10.2217/fmb.12.29. Future Microbiol. 2012. PMID: 22568716 Review.
-
Inflammation as a Modulator of Host Susceptibility to Pulmonary Influenza, Pneumococcal, and Co-Infections.Front Immunol. 2020 Feb 11;11:105. doi: 10.3389/fimmu.2020.00105. eCollection 2020. Front Immunol. 2020. PMID: 32117259 Free PMC article. Review.
Cited by
-
Viral and Bacterial Co-Infections in the Lungs: Dangerous Liaisons.Viruses. 2021 Aug 30;13(9):1725. doi: 10.3390/v13091725. Viruses. 2021. PMID: 34578306 Free PMC article. Review.
-
Immunogenicity and protective efficacy of an intranasal neuraminidase-based influenza vaccine with bacterial cell membrane-derived adjuvants.NPJ Vaccines. 2025 Jul 10;10(1):149. doi: 10.1038/s41541-025-01209-7. NPJ Vaccines. 2025. PMID: 40640198 Free PMC article.
-
Highly specific and rapid glycan based amperometric detection of influenza viruses.Chem Sci. 2017 May 1;8(5):3628-3634. doi: 10.1039/c6sc03720h. Epub 2017 Feb 14. Chem Sci. 2017. PMID: 28580101 Free PMC article.
-
Harnessing Epigenetics: Innovative Approaches in Diagnosing and Combating Viral Acute Respiratory Infections.Pathogens. 2025 Feb 1;14(2):129. doi: 10.3390/pathogens14020129. Pathogens. 2025. PMID: 40005506 Free PMC article. Review.
-
Nasal-spraying Bacillus spore probiotics for pneumonia in children with respiratory syncytial virus and bacterial co-infections: a randomized clinical trial.Commun Med (Lond). 2025 Aug 7;5(1):336. doi: 10.1038/s43856-025-01029-9. Commun Med (Lond). 2025. PMID: 40770421 Free PMC article.
References
Publication types
MeSH terms
LinkOut - more resources
Full Text Sources
Other Literature Sources
Research Materials
Miscellaneous
