. 2015 Feb 1;26(3):467-77.
doi: 10.1091/mbc.E14-07-1247. Epub 2014 Nov 26.

The formin FMNL3 assembles plasma membrane protrusions that participate in cell-cell adhesion

Affiliations

The formin FMNL3 assembles plasma membrane protrusions that participate in cell-cell adhesion

Timothy J Gauvin et al. Mol Biol Cell. .

Abstract

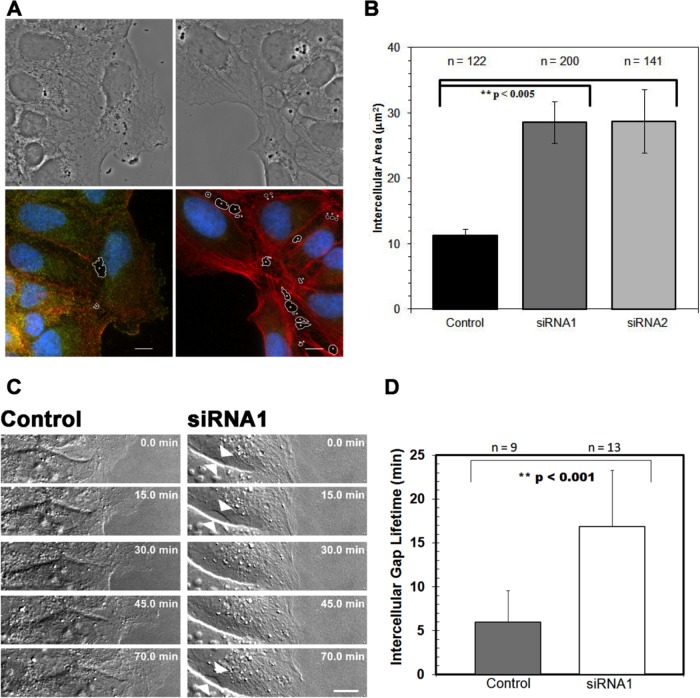
FMNL3 is a vertebrate-specific formin protein previously shown to play a role in angiogenesis and cell migration. Here we define the cellular localization of endogenous FMNL3, the dynamics of GFP-tagged FMNL3 during cell migration, and the effects of FMNL3 suppression in mammalian culture cells. The majority of FMNL3 localizes in a punctate pattern, with >95% of these puncta being indistinguishable from the plasma membrane by fluorescence microscopy. A small number of dynamic cytoplasmic FMNL3 patches also exist, which enrich near cell-cell contact sites and fuse with the plasma membrane at these sites. These cytoplasmic puncta appear to be part of larger membranes of endocytic origin. On the plasma membrane, FMNL3 enriches particularly in filopodia and membrane ruffles and at nascent cell-cell adhesions. FMNL3-containing filopodia occur both at the cell-substratum interface and at cell-cell contacts, with the latter being 10-fold more stable. FMNL3 suppression by siRNA has two major effects: decrease in filopodia and compromised cell-cell adhesion in cells migrating as a sheet. Overall our results suggest that FMNL3 functions in assembly of actin-based protrusions that are specialized for cell-cell adhesion.


Figures

FIGURE 1:
FIGURE 1:
FMNL3 domain map and splice variants. DAD, diaphanous autoregulatory domain. DID, diaphanous inhibitory domain; DD, dimerization domain; FH1, formin homology 1 domain; FH2, formin homology 2 domain; GBD, GTPase-binding domain; WH2L, WH2-like domain. Numbers indicate amino acid positions. Splice variants: DID insert (153–203) and alternate C-termini (NC and PH variants, named by the two C-terminal residues). Red letters represent the last common sequence before the alternative splice site. DAD is predicted to extend into the alternately spliced region (with L1000 predicted to make an important interaction with DID).
FIGURE 2:
FIGURE 2:
Localization of FMNL3 in U2OS cells. U2OS cells were examined in three conditions: (A) plated on glass coverslips overnight, (B) plated on laminin coated slips for 120 min, and (C) during wound-healing assay, 23 h after wounding. Stains are anti-FMNL3 antibody (green), phalloidin for actin filaments (red), and DAPI for DNA (blue). Right, zooms. Arrow in B indicates a filopodium, and arrow in C indicates region of cell–cell contact, which runs diagonally from this arrow to the lower right corner. Scale bars,10 μm (full images), 5 μm (zooms). (D) Histogram of FMNL3 puncta diameters from images of fixed U2OS cells stained with anti-FMNL3 antibodies. Bins are 50 nm, bars are centered at the maximum value of that bin (e.g., bar centered on 350 nm represents 300–350 nm). Similar to images for NIH 3T3 cells shown in Supplemental Figure S1.
FIGURE 3:
FIGURE 3:
FMNL3 translocates to nascent cell–cell junctions upon serum addition. Serum-starved NIH 3T3 cells were treated with serum-containing medium (10% newborn calf serum) for the indicated times and then fixed and stained for FMNL3 (green), N-cadherin (red), and DNA (blue). Scale bar, 10 μm (close-ups, 5 μm ).
FIGURE 4:
FIGURE 4:
Localization of FMNL3 puncta. (A) XZ-projection of fixed U2OS cells immunostained for endogenous FMNL3 (green), plasma membrane (red), and DNA (blue), then imaged by laser scanning confocal microscopy using 100-nm Z-slices. Plasma membrane labeled with FM4-64 (50 μM in Hank's buffered salt solution) for 1 min before fixation. XZ-projection reconstructed using Nikon Elements software with 2× scale of Z-axis. Scale bar, 10 μm (XY), 5 μm (Z). (B) A 3D reconstruction of FMNL3-NC-GFPint (green) and Alexa 647–labeled WGA (red) in live U2OS cell at <1 min after WGA treatment (top) and at 5 min after treatment (bottom). The Z-stack was deconvolved before assembling the 3D image. Scale bar, 2 μm (XY), 1 μm (Z). See corresponding Supplemental Movies S1 and S2.
FIGURE 5:
FIGURE 5:
Dynamics of cytoplasmic FMNL3 puncta near cell–cell contact sites. (A) Individual time points from Supplemental Movie S2, following cytoplasmic FMNL3-NC-GFPint puncta near the cell–cell contact. Note the circled punctum, which has recently undergone fission from the larger punctum and fuses with the plasma membrane (arrow). Scale bar, 5 μm. See corresponding Supplemental Movie S3. (B) Trajectory plots for individual intracellular puncta, with the origin representing the starting position for each punctum. Units are in pixels, 0.151 μm/pixel. (C) Single time frame (14 min) from live-cell recording, showing FMNL3-NC-GFPint (green) and Alexa 647–WGA (red) after >10 min of WGA treatment, which allows time for endocytic uptake of WGA. Individual FMNL3 (left) and WGA (center) are also shown in black and white. Box indicates approximate region shown in D and Supplemental Movie S4. Scale bar, 5 μm. (D) Montage taken from Supplemental Movie S4, showing FMNL3-NC-GFPint (green) and WGA (red) dynamics over 50-s period (individual frames represent 10-s intervals). Two WGA-containing particles are labeled. Particle 1 is relatively static over this time period, whereas particle 2 moves rapidly, becoming dimmer but still distinguishable during the process. See also Supplemental Movie S4 from 14:10 to 15:00. Scale bar, 2 μm.
FIGURE 6:
FIGURE 6:
Dynamics of FMNL3 in basal puncta, membrane ruffles, and filopodia. All images use U2OS cells expressing FMNL3-NC-GFPint. (A) Three frames of a time-lapse movie examining FMNL3 on the basal surface, with the overlay of the three frames on the right. In the overlay, note the preponderance of white puncta, indicating that they did not displace significantly over the 4-min viewing time. Scale bar, 5 μm. (B) 3D reconstructions of protrusive regions, with FMNL3 in green and either LifeAct (left) or WGA (right) in red. Ruffles protrude above the apical cell surface. (C) Individual frames from time-lapse movies, tracking FMNL3 and either LifeAct (top) or WGA (bottom). Scale bar, 5 μm. Corresponds to Supplemental Movie S5 (LifeAct). (D) Individual frames from time-lapse movies following FMNL3 in filopodia at a free cell edge (“edge,” top) or a cell edge that is in contact with another cell (“contact,” bottom). In the latter case, the cell being contacted is not expressing FMNL3 (and is invisible here but visible by DIC microscopy). Scale bar, 5 μm. Corresponds to Supplemental Movies S6 and S7. (E) Filopodia lifetimes for contact and edge filopodia, measured from five cells. A substantial proportion of contact filopodia were present for the entire recorded time (27 min).
FIGURE 7:
FIGURE 7:
Effects of FMNL3 suppression in U2OS cells. (A) Western blot showing suppression of FMNL3 using two different siRNAs. (B) Percentage suppression, determined by density measurements from Western blots. (C) Quantification of average puncta per 10 μm2 area in control and FMNL3-depleted cells. Error bars represent SD. (D) Cells plated on laminin-coated coverslips for 90 min for control (top) and siRNA1 treatment (bottom). Stains were for FMNL3 (green), actin filaments (red), and DNA (blue). Scale bar, 10 μm. (E) Close-ups of spreading edge in control (left) siRNA knockdown (right column) shows decrease of filopodia present along the edge compared with control (left column). Filopodia indicated with arrows. Scale bar, 5 μm. (F) Graph quantifying filopodia density as filopodia per 10-μm length along the spreading edge. Error bars indicate SD; p < 0.001.
FIGURE 8:
FIGURE 8:
FMNL3 suppression reduces filopodial number and lifetime at leading edge of U2OS cells in wound-healing assays. (A) Time-lapse montage of DIC images of leading edge of cells in control and knockdown cells. Arrows indicate filopodia. Scale bar, 10 μm. Corresponds to Supplemental Movies S8 and S9. (B) Quantification of average filopodium lifetime. Error bars indicate SD. (C) Quantification of filopodia assembly frequency. Error bars indicate SD.
FIGURE 9:
FIGURE 9:
FMNL3 suppression increases intercellular gaps between U2OS cells in wound- healing assays. (A) Phase-contrast (top) and merged fluorescence images (bottom) of FMNL3 (green), actin (red), and DNA (blue) along wound edge of control (left) and siRNA1-treated cells (right) show an increase of intercellular gaps (marked by asterisks) upon FMNL3 depletion. Scale bars, 10 μm. Corresponds to Supplemental Movies S10 and S11. (B) Graph shows average areas of intercellular spaces. Error bars show SEM; p < 0.005. (C) DIC time-lapse montage of wound edge in control and knockdown cells. Arrows indicate intercellular gaps forming during time lapse. Scale bar indicates 10 μm. (D) Average lifetime of intercellular gaps during wound healing. Error bars indicate SD.

References

    1. Adams CL, Chen YT, Smith SJ, Nelson WJ. Mechanisms of epithelial cell-cell adhesion and cell compaction revealed by high-resolution tracking of E-cadherin-green fluorescent protein. J Cell Biol. 1998;142:1105–1119. - PMC - PubMed
    1. Akhtar N, Hotchin NA. RAC1 regulates adherens junctions through endocytosis of E-cadherin. Mol Biol Cell. 2001;12:847–862. - PMC - PubMed
    1. Bai SW, Herrera-Abreu MT, Rohn JL, Racine V, Tajadura V, Suryavanshi N, Bechtel S, Wiemann S, Baum B, Ridley AJ. Identification and characterization of a set of conserved and new regulators of cytoskeletal organization, cell morphology and migration. BMC Biol. 2011;9:54. - PMC - PubMed
    1. Block J, Breitsprecher D, Kuhn S, Winterhoff M, Kage F, Geffers R, Duwe P, Rohn JL, Baum B, Brakebusch C, et al. FMNL2 drives actin-based protrusion and migration downstream of Cdc42. Curr Biol. 2012;22:1005–1012. - PMC - PubMed
    1. Brevier J, Montero D, Svitkina T, Riveline D. The asymmetric self-assembly mechanism of adherens junctions: a cellular push-pull unit. Phys Biol. 2008;5:016005. - PubMed

Publication types

LinkOut - more resources