. 2015 Mar;32(3):674-89.
doi: 10.1093/molbev/msu328. Epub 2014 Nov 25.

The evolution and adaptive potential of transcriptional variation in sticklebacks--signatures of selection and widespread heritability

Affiliations

The evolution and adaptive potential of transcriptional variation in sticklebacks--signatures of selection and widespread heritability

Erica H Leder et al. Mol Biol Evol. 2015 Mar.

Abstract

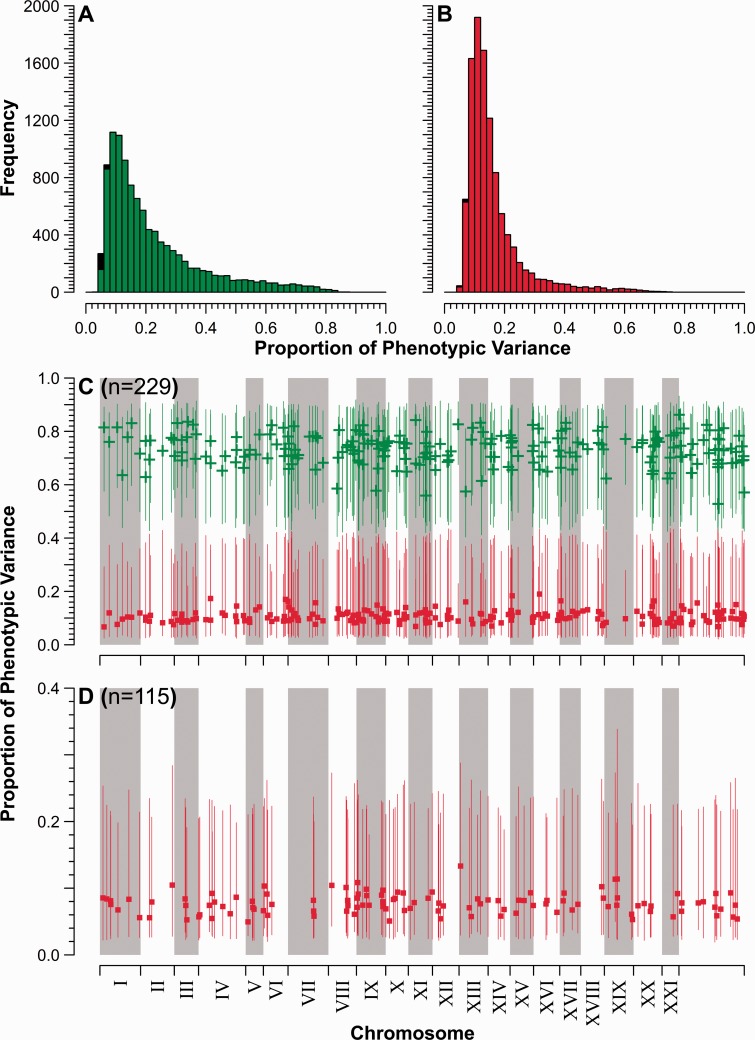
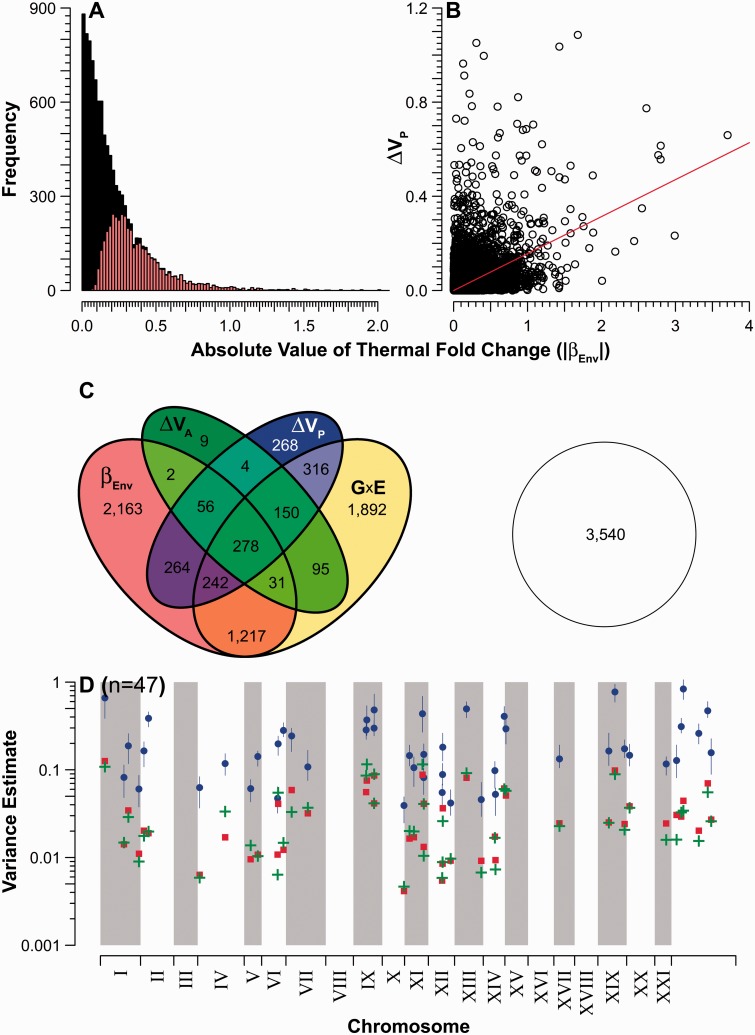
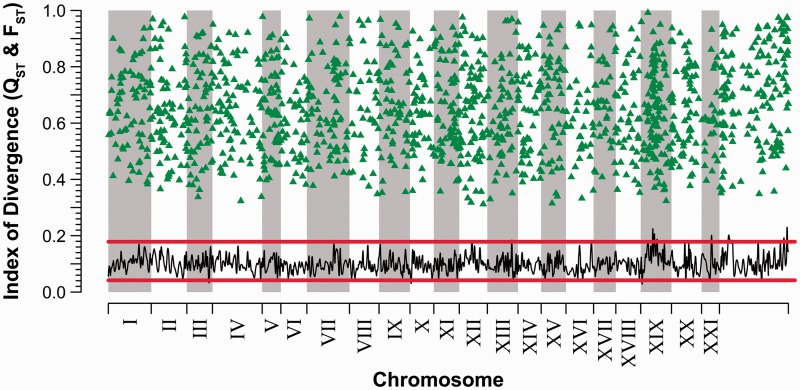
Evidence implicating differential gene expression as a significant driver of evolutionary novelty continues to accumulate, but our understanding of the underlying sources of variation in expression, both environmental and genetic, is wanting. Heritability in particular may be underestimated when inferred from genetic mapping studies, the predominant "genetical genomics" approach to the study of expression variation. Such uncertainty represents a fundamental limitation to testing for adaptive evolution at the transcriptomic level. By studying the inheritance of expression levels in 10,495 genes (10,527 splice variants) in a threespine stickleback pedigree consisting of 563 individuals, half of which were subjected to a thermal treatment, we show that 74-98% of transcripts exhibit significant additive genetic variance. Dominance variance is also prevalent (41-99% of transcripts), and genetic sources of variation seem to play a more significant role in expression variance in the liver than a key environmental variable, temperature. Among-population comparisons suggest that the majority of differential expression in the liver is likely due to neutral divergence; however, we also show that signatures of directional selection may be more prevalent than those of stabilizing selection. This predominantly aligns with the neutral model of evolution for gene expression but also suggests that natural selection may still act on transcriptional variation in the wild. As genetic variation both within- and among-populations ultimately defines adaptive potential, these results indicate that broad adaptive potential may be found within the transcriptome.

Keywords: Gasterosteus aculeatus; QST; gene expression; microarray; quantitative genetics; transcriptome.


Figures

F<sc>ig</sc>. 1.
Fig. 1.
Proportion of phenotypic variance explained by additive genetic and dominance variance. (A) Frequency distribution of narrow-sense heritability (h2) estimates for all 10,527 transcripts. Nonsignificant estimates are represented in the black fraction, whereas statistically significant estimates are plotted in gray (green online). (B) Distribution of estimates for the dominance proportion of total phenotypic variance (d2). Significant estimates are plotted in gray (red online), nonsignificant in black. (C) Chromosomal location of the 229 transcripts for which h2 is significantly greater than d2. Point estimates of h2 are plotted as “+” (green online); d2 are squares (red online). Vertical lines denote 95% PDIs. Mitochondria and unlinked scaffold are combined in the region to the right of chromosome XXI. (D) Chromosomal location of the 115 transcripts with putatively significant d2 and nonsignificant h2 estimates—note that these may represent “false positive” estimates on the basis of phenotypic simulations (d2 ≤ 0.144). Symbols and chromosomal arrangement as in (C).
F<sc>ig</sc>. 2.
Fig. 2.
Significant temperature effects on transcript expression. (A) Distribution of fixed-effects coefficients describing the effect of thermal treatment on mean transcript expression (βEnv). The gray fraction (colored online) denotes statistically significant values. (B) Relationship between βEnv and ΔVP, the difference in total phenotypic variance estimated in the two temperature treatments. In total, 6,987 transcripts with a temperature response are plotted. (C) Union of transcripts based on their significance with respect to various indicators of environmental effects. Indicators include βEnv, differences in temperature-specific estimates of additive genetic variance (ΔVA), G×E, and ΔVP. Overlapping regions denote multiple significant effects. The open circle represents the proportion of nonsignificant transcripts. (D) Chromosomal location of the 47 transcripts for which the magnitude of ΔVP exceeded interval estimates of both VA and VD. For clarity, only point estimates are provided for VA (+) and VD (squares); circles represent point estimates of ΔVP, bounded by 95% PDIs (vertical lines). Chromosomal arrangement as in figure 1.
F<sc>ig</sc>. 3.
Fig. 3.
Among-population divergence in transcript abundance, plotted as a function of genomic location. Loess smoothing (5-kb intervals) of lower 95% posterior density interval values indicate putative genomic regions rich in adaptive expression divergence. Triangles denote QST point estimates for transcripts which significantly exceed a baseline of neutral divergence, as defined by 17 microsatellite markers (range defined by horizontal lines; see Materials and Methods for details). For clarity, probes whose levels of expression divergence fell within the range of neutral differentiation are not shown. Chromosomal arrangement as in figures 1 and 2.

References

    1. Antao T, Lopes A, Lopes RJ, Beja-Pereira A, Luikart G. LOSITAN: a workbench to detect molecular adaptation based on a FST-outlier method. BMC Bioinformatics. 2008;9:323. - PMC - PubMed
    1. Aubin-Horth N, Renn SCP. Genomic reaction norms: using integrative biology to understand molecular mechanisms of phenotypic plasticity. Mol Ecol. 2009;18:3763–3780. - PubMed
    1. Ayroles JF, Carbone MA, Stone EA, Jordan KW, Lyman RF, Magwire MM, Rollmann SM, Duncan LH, Lawrence F, Anholt RRH, et al. Systems genetics of complex traits in Drosophila melanogaster. Nat Genet. 2009;41:299–307. - PMC - PubMed
    1. Bar-Even A, Paulsson J, Maheshri N, Carmi M, O’Shea E, Pilpel Y, Barkai N. Noise in protein expression scales with natural protein abundance. Nat Genet. 2006;38:636–643. - PubMed
    1. Barber I, Arnott SA. Split-clutch IVF: a technique to examine indirect fitness consequences of mate preferences in sticklebacks. Behaviour. 2000;137:1129–1140.

Publication types