

Calibration uncertainty in molecular dating analyses: there is no substitute for the prior evaluation of time priors
- PMID: 25429012
- PMCID: PMC4262156
- DOI: 10.1098/rspb.2014.1013
Calibration uncertainty in molecular dating analyses: there is no substitute for the prior evaluation of time priors
Abstract
Calibration is the rate-determining step in every molecular clock analysis and, hence, considerable effort has been expended in the development of approaches to distinguish good from bad calibrations. These can be categorized into a priori evaluation of the intrinsic fossil evidence, and a posteriori evaluation of congruence through cross-validation. We contrasted these competing approaches and explored the impact of different interpretations of the fossil evidence upon Bayesian divergence time estimation. The results demonstrate that a posteriori approaches can lead to the selection of erroneous calibrations. Bayesian posterior estimates are also shown to be extremely sensitive to the probabilistic interpretation of temporal constraints. Furthermore, the effective time priors implemented within an analysis differ for individual calibrations when employed alone and in differing combination with others. This compromises the implicit assumption of all calibration consistency methods, that the impact of an individual calibration is the same when used alone or in unison with others. Thus, the most effective means of establishing the quality of fossil-based calibrations is through a priori evaluation of the intrinsic palaeontological, stratigraphic, geochronological and phylogenetic data. However, effort expended in establishing calibrations will not be rewarded unless they are implemented faithfully in divergence time analyses.
Keywords: Bayesian; calibration; cross-validation; fossil record; molecular clock; priors.
Figures
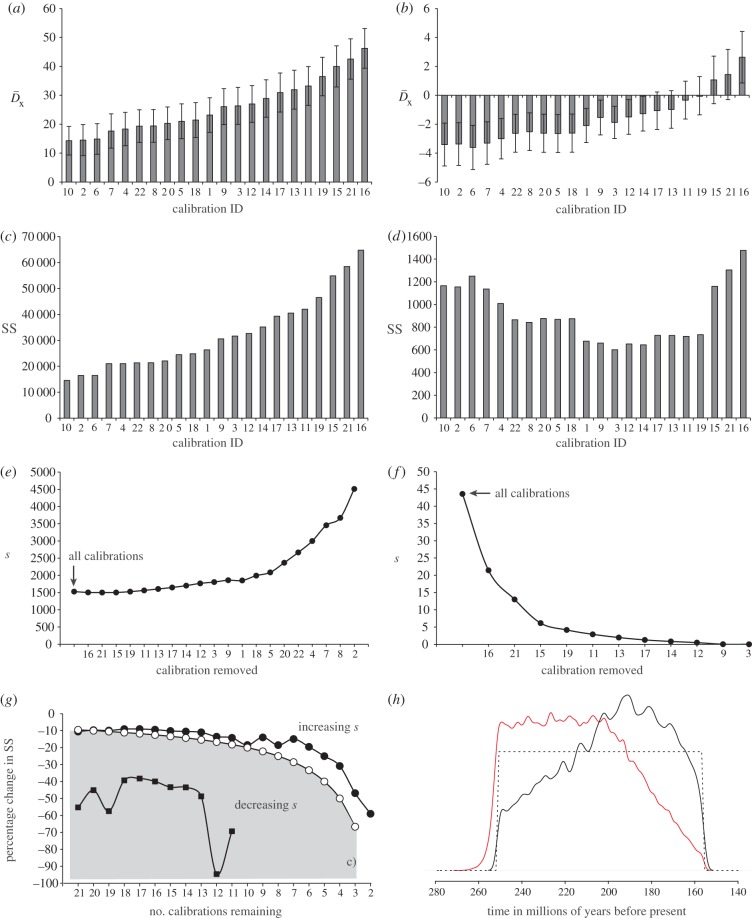
 ) (a,b) and the sum of squared differences (SS) (c,d) between molecular- and fossil-based estimates obtained during each round of cross-validation. The values obtained when fossil-based minima are used to calculate
  (a) and SS (c), and the values obtained when both minima and maxima are considered in the estimation of
  (b) and SS (d). The error bars shown in (a,b) reflect the standard error of the mean. (e–f) Plots showing the impact of sequentially removing calibrations on the average squared deviation(s) between molecular—and fossil—estimates considering minima only (e) and both minima and maxima (f). Sequential removal of the most inconsistent calibrations revealed a consistent, albeit statistically non-significant increase in s when only the fossil-based minima are used in the estimation of SS (f). By contrast, there is a steady albeit statistically non-significant decline in s when minimum and maximum temporal constraints are used to calculate SS (e). The value of s will increase if the rate of change of the denominator, n(n – 1) in the equation used to calculate s, exceeds the rate of change of the numerator ∑SS, where n represents the total number of calibrations [38]. (g) Illustrates the percentage change in ∑SS with the sequential removal of calibrations, estimated using minima (black circles) or both minima and maxima (black squares). This is contrasted to the rate of change of n(n – 1), where n represents to total number of calibrations used to calculate s (open circles). The rate of change of n(n – 1) always exceeds the rate of change of ∑SS when fossil minima are used in the calculation, hence we observe an increase in s. The converse is true when both minimum and maximum constraints are incorporated into the estimation of SS. Changes in s fluctuate markedly with the removal of calibrations as the value of s approaches zero; SS = 0 with the inclusion of the final 10 calibrations. (h) The effect of truncation in the establishment of the joint time prior at the root (node 1, figure 3) in BEAST (black) and MCMCT
References
-
- dos Reis M, Yang ZH. 2013. The unbearable uncertainty of Bayesian divergence time estimation. J. Syst. Evol. 51, 30–43. (10.1111/J.1759-6831.2012.00236.X) - DOI
-
- Benton MJ, Donoghue PCJ, Asher RJ. 2009. Calibrating and constraining molecular clocks. In The timetree of life (eds Hedges SB, Kumar S.), pp. 35–86. Oxford, UK: Oxford University Press.
Publication types
MeSH terms
Grants and funding
LinkOut - more resources
Full Text Sources
Other Literature Sources
Research Materials