. 2015 Feb 15;113(4):1184-94.
doi: 10.1152/jn.00835.2014. Epub 2014 Nov 26.

Intrinsic neurophysiological properties of hilar ectopic and normotopic dentate granule cells in human temporal lobe epilepsy and a rat model

Affiliations

Intrinsic neurophysiological properties of hilar ectopic and normotopic dentate granule cells in human temporal lobe epilepsy and a rat model

A L Althaus et al. J Neurophysiol. .

Abstract

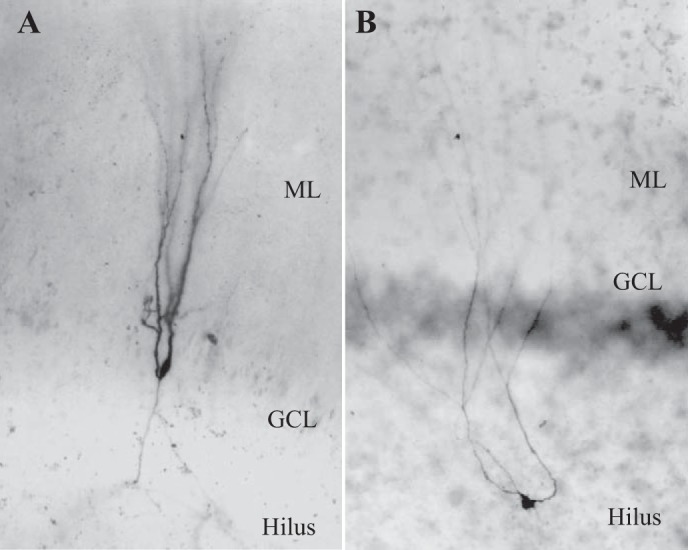
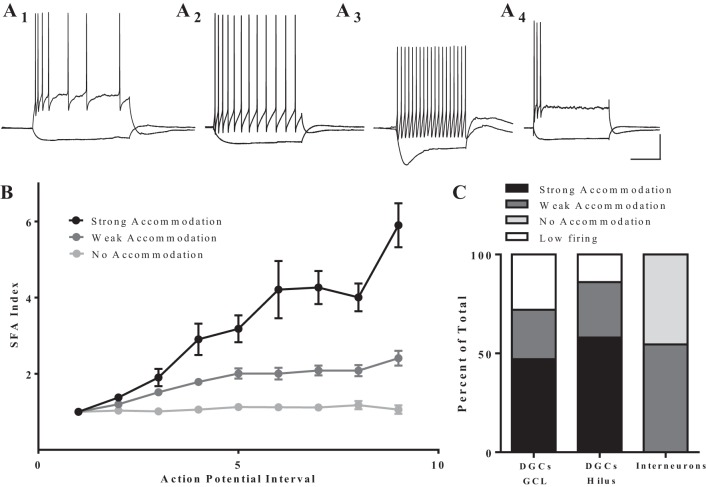
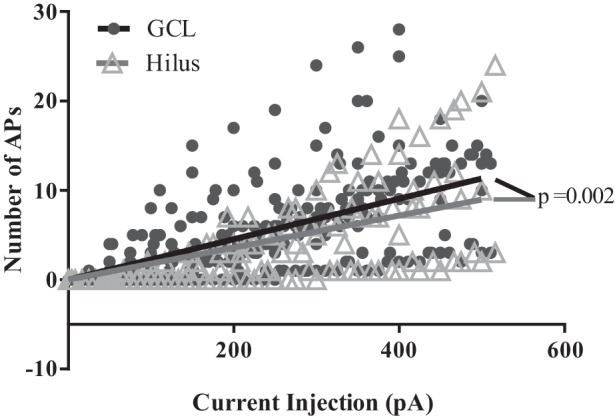
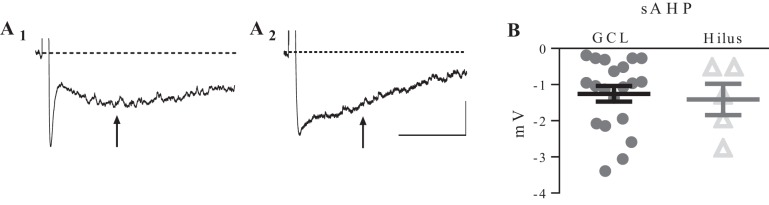
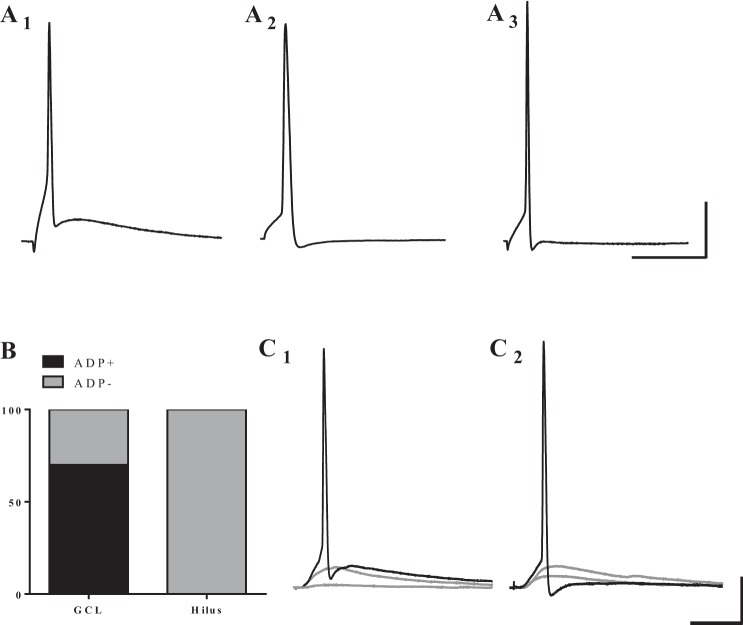
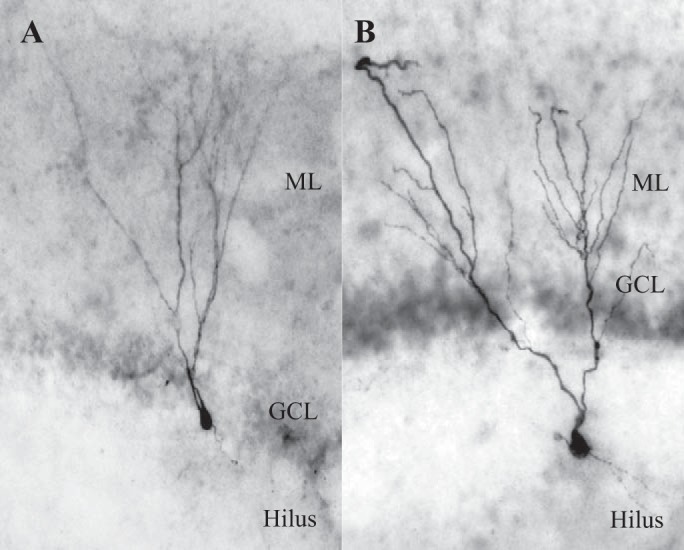
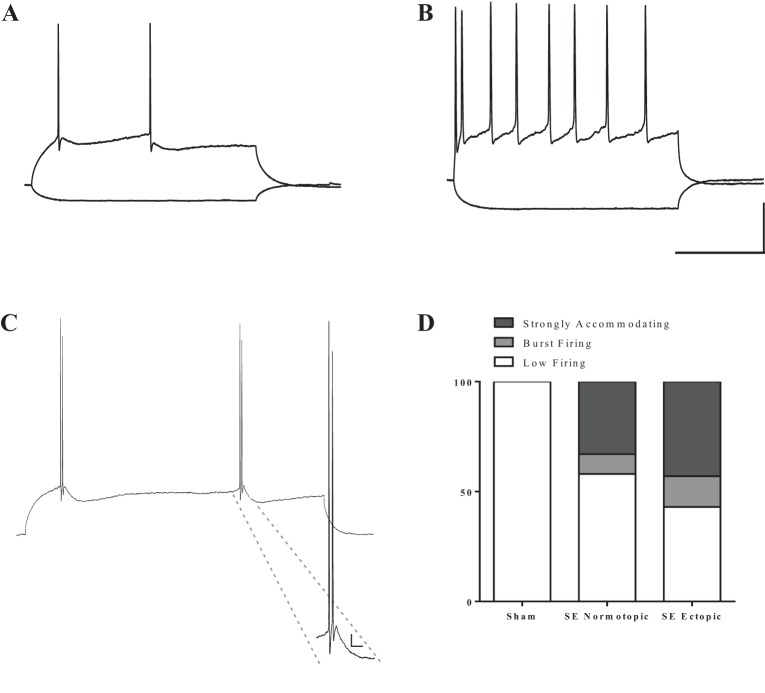
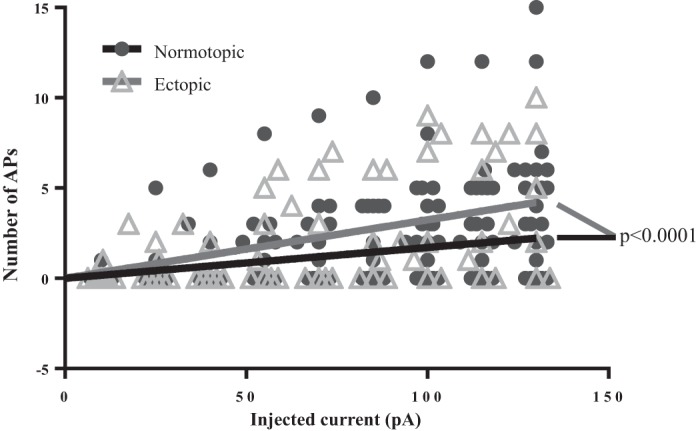
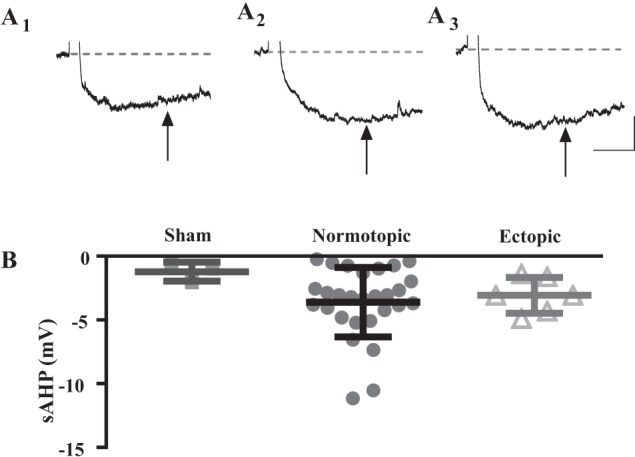
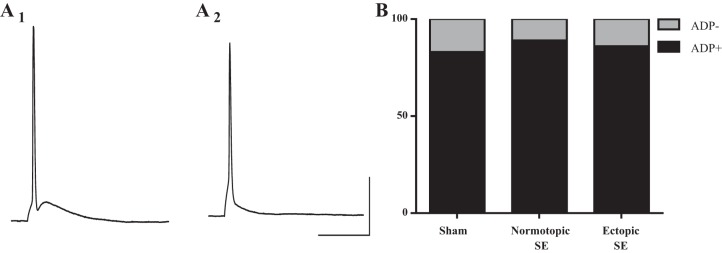
Hilar ectopic dentate granule cells (DGCs) are a salient feature of aberrant plasticity in human temporal lobe epilepsy (TLE) and most rodent models of the disease. Recent evidence from rodent TLE models suggests that hilar ectopic DGCs contribute to hyperexcitability within the epileptic hippocampal network. Here we investigate the intrinsic excitability of DGCs from humans with TLE and the rat pilocarpine TLE model with the objective of comparing the neurophysiology of hilar ectopic DGCs to their normotopic counterparts in the granule cell layer (GCL). We recorded from 36 GCL and 7 hilar DGCs from human TLE tissue. Compared with GCL DGCs, hilar DGCs in patient tissue exhibited lower action potential (AP) firing rates, more depolarized AP threshold, and differed in single AP waveform, consistent with an overall decrease in excitability. To evaluate the intrinsic neurophysiology of hilar ectopic DGCs, we made recordings from retrovirus-birthdated, adult-born DGCs 2-4 mo after pilocarpine-induced status epilepticus or sham treatment in rats. Hilar DGCs from epileptic rats exhibited higher AP firing rates than normotopic DGCs from epileptic or control animals. They also displayed more depolarized resting membrane potential and wider AP waveforms, indicating an overall increase in excitability. The contrasting findings between disease and disease model may reflect differences between the late-stage disease tissue available from human surgical specimens and the earlier disease stage examined in the rat TLE model. These data represent the first neurophysiological characterization of ectopic DGCs from human hippocampus and prospectively birthdated ectopic DGCs in a rodent TLE model.

Keywords: dentate gyrus; ectopic; epileptogenesis; intrinsic excitability; seizure.


Figures

Fig. 1.
Fig. 1.
Biocytin filled cells display dentate granule cell (DGC) morphology. A: typical human DGC with soma in the granule cell layer (GCL), dendrites in the molecular layer (ML), and axon in the hilus. B: physiologically identified human DGC with hilar ectopic soma.
Fig. 2.
Fig. 2.
Cells display distinct spike frequency accommodation (SFA) patterns, which help to distinguish DGCs from interneurons. A: representative traces of firing pattern in response to a depolarizing step (500 ms). A1: strong accommodation (n = 21). A2: weak accommodation (n = 11). A3: no accommodation (n = 6). A4: low firing [did not fire more than 3 action potentials (APs) in a spike train at the highest level of stimulation]. For such cells (n = 11), SFA index could not be calculated. Scale bar: 200 ms, 25 mV. B: plot of SFA index vs AP interval. Strongly accommodating cells reached an SFA index value of at least 3 by the end of the spike train, while the value for weakly accommodating cells never exceeded 2.5, and the value for nonaccommodating cells never exceeded 1.2. Values are means ± SE. C: distribution of SFA types among DGCs in the GCL, DGCs cells in the hilus, and cells that do not fit physiological characterization of DGCs (putative interneurons). There was no significant difference in the distribution of firing patterns between DGCs in the hilus or the GCL (P = 0.75, Fisher's exact test).
Fig. 3.
Fig. 3.
Hilar DGCs are slightly, but significantly, less excitable than DGCs in the GCL. All cells fire at least one AP in response to ≥300 pA of injected current. The solid black and gray lines were generated by fitting the respective scatter plot data with a Poisson regression line that passes through the origin. The slope of the regression line for hilar cells (0.01794 ± 0.001277) is significantly different from the slope of the line for GCL cells (0.02266 ± 0.0015, P = 0.0019, extra sum of squares F-test).
Fig. 4.
Fig. 4.
Cells in GCL and hilus exhibited a prominent postburst after hyperpolarizaion. A1: sample trace from a cell in the GCL. A2: trace from a cell in the hilus. Arrows indicate when the slow afterhyperpolarization (sAHP) component was measured. B: the average amplitude of the sAHP recorded from cells in the GCL (n = 30) and the hilus (n = 6) was not significantly different (P = 0.48 unpaired t-test). Values are means ± SE. Scale bars: 1 s, 2 mV.
Fig. 5.
Fig. 5.
Cells in the GCL exhibit two distinct single AP waveforms in response to short depolarizing pulses, while hilar DGCs all exhibit similar waveforms. A: example traces of APs elicited by direct, somatic current injection. Cells in the GCL display AP traces: with an afterdepolarization (ADP; A1), or without an ADP (A2). A3: hilar cells only exhibit APs without an ADP. B: distribution of cells that fired each type of AP classified by location. The majority of cells in the GCL fired APs with an ADP (25/36), while none of the 7 hilar cells exhibited an ADP. C: a subset of cells in both the GCL and hilus could be driven synaptically to fire single APs. Of these cells, some fired an AP with ADP (C1), and others fired an AP without ADP (C2). Scale bars: 25 ms and 20 mV.
Fig. 6.
Fig. 6.
Biocytin filled cells display DGC morphology. A: typical rat DGC with soma in the GCL and dendrites in the ML. B: rat DGC with hilar ectopic soma.
Fig. 7.
Fig. 7.
All cells from rodent tissue display firing behavior characteristic of DGCs. A: sample trace from a low firing cell. These cells only fired up to 3 APs in response to injected current. B: sample trace from a cell with sustained firing in response to injected current. Cells that fired 4 or more APs always exhibited strong SFA (an index value of at least 3.0). Scale bars: 200 ms, 25 mV. C: a small subset of cells from epileptic tissue fired AP doublets, even in response to low levels of current injection. Inset presents a larger image of the doublet. These were classified as burst firing cells. Scale bar: 20 ms, 5 mV. D: distribution of firing patterns among cells in each group. There was no significant difference between the firing pattern distributions of normotopic vs. ectopic DGCs (P = 0.73 Fisher's exact test). SE, status epilepticus.
Fig. 8.
Fig. 8.
Ectopic DGCs from rodent SE tissue exhibit a moderate, but significant, increase in excitability compared with normotopic DGCs. Both normotopic and ectopic DGCs born after SE exhibit more excitability than age-matched DGCs from sham-treated animals. All cells in the sham group were low-firing cells, so only cells from SE-treated animals were included for comparison of firing frequency. The solid black and gray lines were generated by fitting the respective scatter plot data with a Poisson regression line that passes through the origin. The slope of the line for ectopic DGC firing (0.032 ± 0.0038) is significantly different from the slope of the line for normotopic DGC firing (0.017 ± 0.0014; P < 0.0001, extra sum of squares F-test).
Fig. 9.
Fig. 9.
A subset of cells from each group exhibited postburst sAHP. Representative traces are from a cell from a sham-treated animal (A1), a normotopic cell from an SE-treated animal (A2), and an ectopic cell from an SE-treated animal (A3). B: there was no significant difference in the mean size of the postburst sAHP between any of the groups (P = 0.311, one-way ANOVA). All values are means ± SE. Scale bars: 500 ms, 2 mV.
Fig. 10.
Fig. 10.
Two distinct shapes of single AP traces were observed in all three groups of rodent DGCs. Example trace showing AP: with a prominent ADP (A1) and without an ADP (A2). B: graph showing the distribution of single-spike AP type across all groups. There was no significant difference in the percentage of cells that fired each type of AP across any of the three groups (P = 0.91, Fisher's exact test). Scale bars: 20 ms, 25 mV.

References

    1. Agrawal N, Alonso A, Ragsdale DS. Increased persistent sodium currents in rat entorhinal cortex layer V neurons in a post-status epilepticus model of temporal lobe epilepsy. Epilepsia 44: 1601–1604, 2003. - PubMed
    1. Althaus AL, Parent JM. Role of adult neurogenesis in seizure-induced hippocampal remodeling and epilepsy. In: Endogenous Stem Cell-Based Brain Remodeling in Mammals, edited by Junier M.-P., Kernie SG. Boston, MA: Springer, 2014, p. 87–104.
    1. Aradi I, Holmes WR. Role of multiple calcium and calcium-dependent conductances in regulation of hippocampal dentate granule cell excitability. J Comput Neurosci 6: 215–235, 1999. - PubMed
    1. Azouz R, Jensen MS, Yaari Y. Ionic basis of spike after-depolarization and burst generation in adult rat hippocampal CA1 pyramidal cells. J Physiol 492: 211–223, 1996. - PMC - PubMed
    1. Chen S, Su H, Yue C, Remy S, Royeck M Sochivko D, Opitz T, Beck H, Yaari Y. An increase in persistent sodium current contributes to intrinsic neuronal bursting after status epilepticus. J Neurophysiol 105: 117–129, 2011. - PubMed

Publication types

LinkOut - more resources