. 2014 Nov 26;34(48):15931-46.
doi: 10.1523/JNEUROSCI.1818-14.2014.

Mesoscale transcranial spontaneous activity mapping in GCaMP3 transgenic mice reveals extensive reciprocal connections between areas of somatomotor cortex

Affiliations

Mesoscale transcranial spontaneous activity mapping in GCaMP3 transgenic mice reveals extensive reciprocal connections between areas of somatomotor cortex

Matthieu P Vanni et al. J Neurosci. .

Abstract

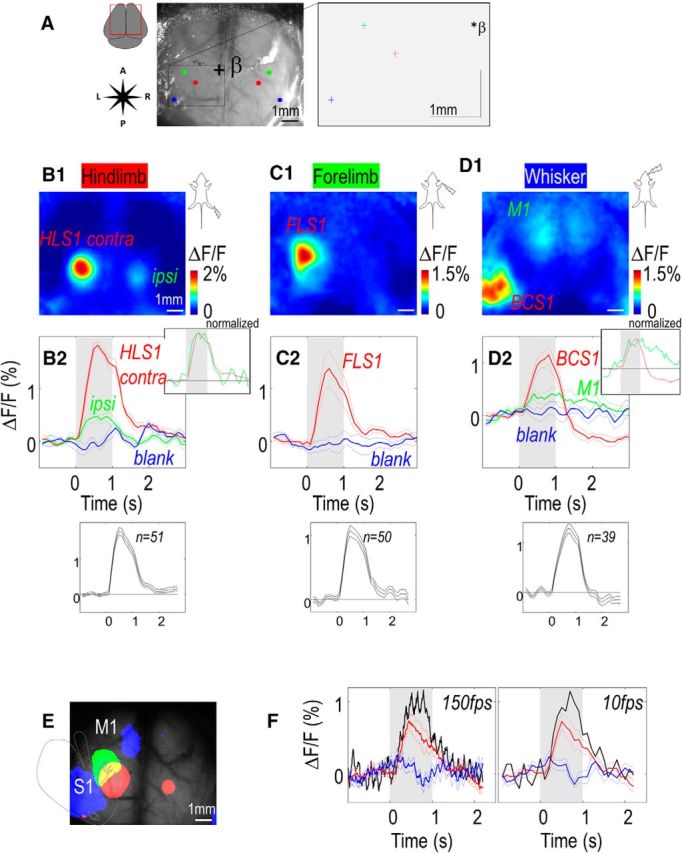
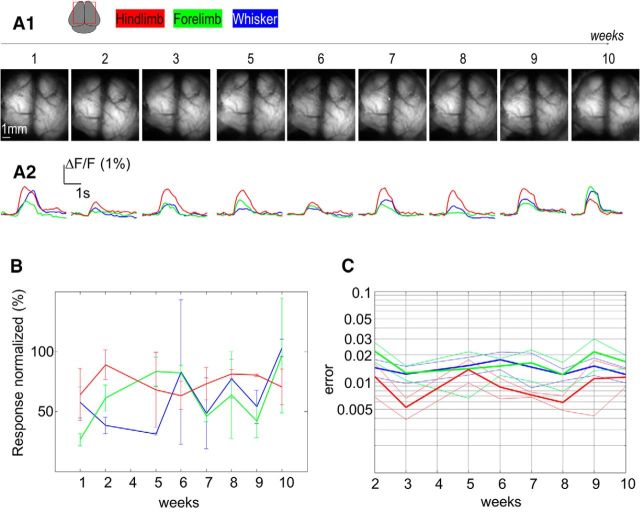
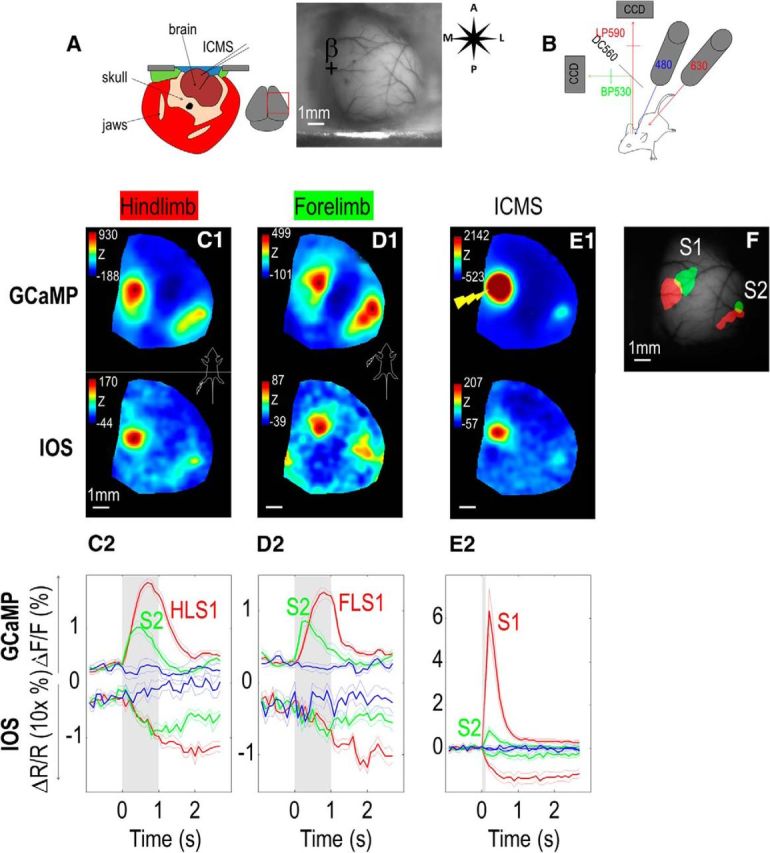
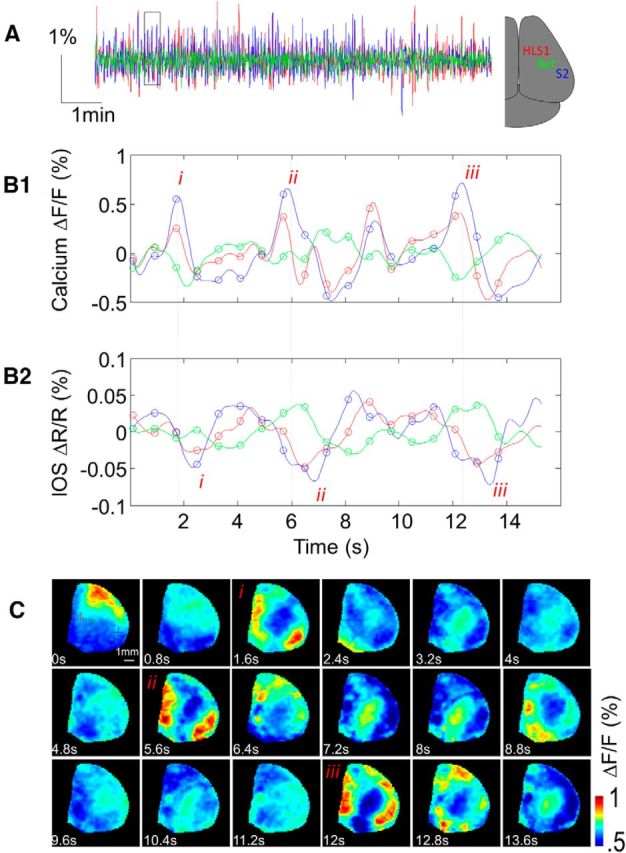
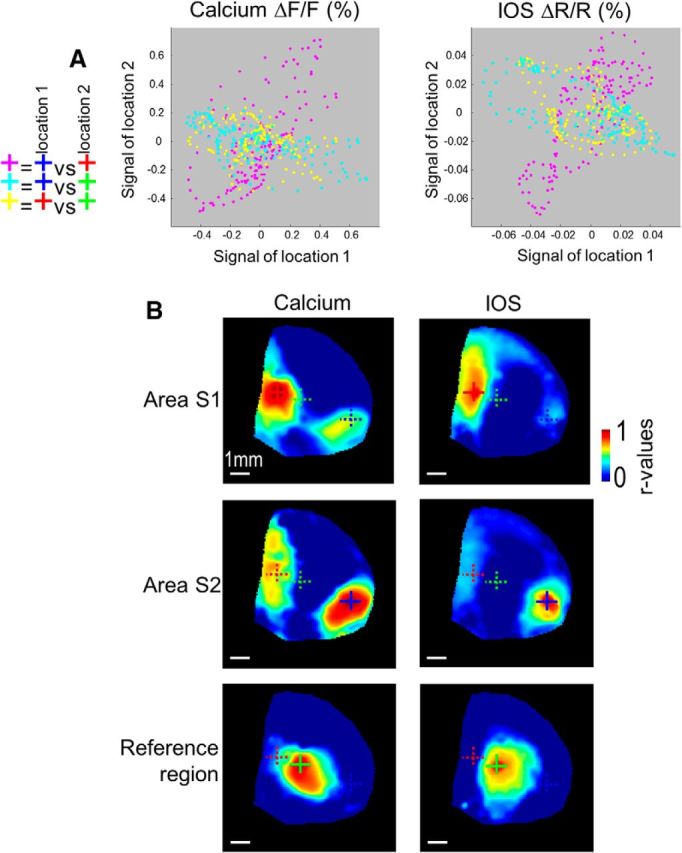
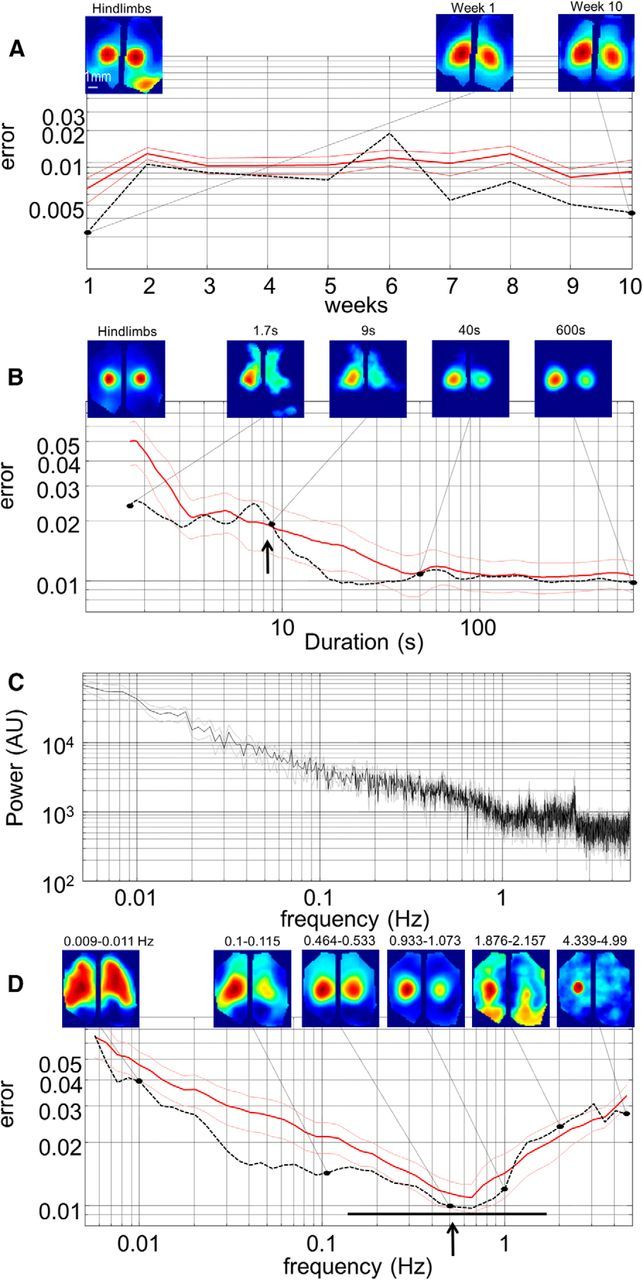
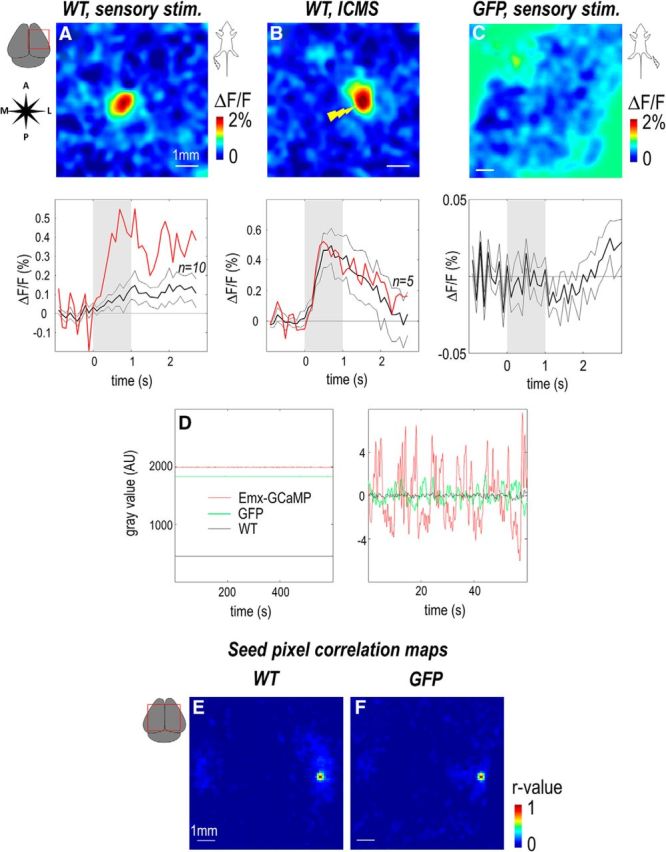
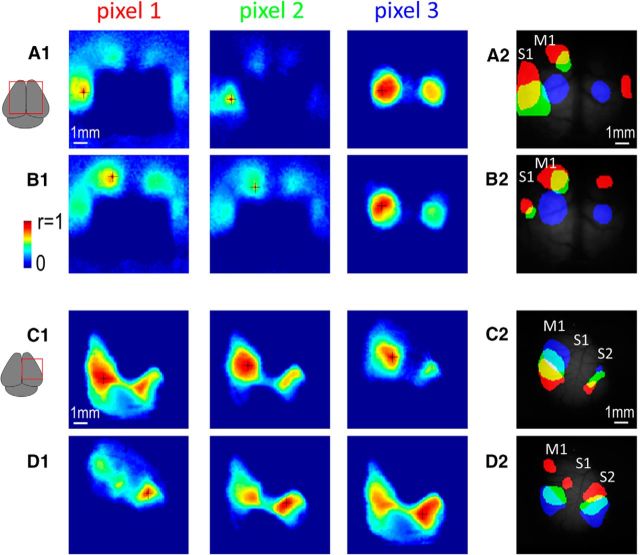
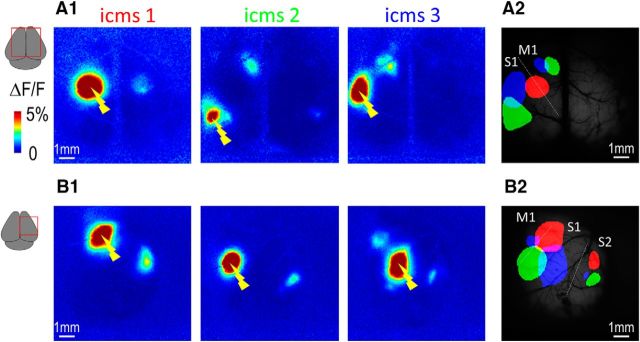
Transgenic mice expressing genetically encoded activity indicators are an attractive means of mapping mesoscopic regional functional cortical connectivity given widespread stable and cell-specific expression compatible with chronic recordings. Cortical functional connectivity was evaluated using wide-field imaging in lightly anesthetized Emx1-creXRosa26-GCaMP3 mice expressing calcium sensor in cortical neurons. Challenges exist because green fluorescence signals overlap with endogenous activity-dependent autofluorescence and are affected by changes in blood volume and oxygenation. Under the conditions used for imaging and analysis (0.1-1 Hz frequency band), autofluorescence and hemodynamic effects contributed 3% and 8% of the SD of spontaneous activity-dependent GCaMP3 fluorescence when signals were recorded through intact bone. To evaluate the accuracy and sensitivity of this approach, the topology of functional connections between somatomotor cortex (primary S1 and secondary S2 somatosensory, and primary motor cortex M1) was estimated. During sequences of spontaneous activity, calcium signals recorded at each location of area S1 were correlated with activity in contralateral area S1, ipsilateral area S2, and bilateral areas M1. Reciprocal results were observed when "seed pixels" were placed in S2 and M1. Coactivation of areas implies functional connections but could also be attributed to both regions receiving common upstream drive. These apparent connections revealed during spontaneous activity coactivation by GCaMP3 were confirmed by intracortical microstimulation but were more difficult to detect using intrinsic signals from reflected red light. We anticipate GCAMP wide-field imaging will enable longitudinal studies during plasticity paradigms or after models of CNS disease, such as stroke, where the weighting within these connectivity maps may be altered.

Keywords: connectome; cortical stimulation; optogenetic; resting state; tracing; transgenic mice.


Figures

Figure 1.
Figure 1.
Cortical expression in Emx-GCaMP mice and chronic window. A, Cortical expression of GCaMP3 gene (in situ hybridization) in Emx-GCaMP animals. These data were collected for the experiment #100132540 of the Allen Brain Institute (Brain Atlas, Transgenic characterization: http://connectivity.brain-map.org/transgenic/experiment/100132540). B, In vivo two photon microscopy of the SR101 (top left) and GCaMP3 (top right) expression in cortex of Emx-GCaMP mice (excitation: 920 nm; depth: 120 μm). The imaging procedure was similar to those used in our previous studies (Winship et al., 2007). Bottom, SR101 (red) and GCaMP3 (green) expression merged and profile of the GCaMP3 against the SR101 expression. C, Left, Postmortem confocal microscopy of GCaMP3 fluorescence in cortical slices. Middle, Immunochemistry of rabbit antibodies to S100β revealed with Texas-RED-tagged secondary antibodies. Right, Merged images. The red and green arrows indicate a S100β positive/GCaMP3 negative cell and a S100β negative/GCaMP3 positive cell, respectively. D, Diagram of the chronic window implant in a sagittal (left) and coronal section (middle) of the head. Right, Diagram of the brain area exposed by the window.
Figure 2.
Figure 2.
Sensory response recorded through a bilateral chronic window. A, Left, Green reflectance image. β indicates bregma. Colored circle represents locations of activations for HL, FL, and WS piezo-stimulation (1 s train of 1 ms pulses, 100 Hz). Right, Locations of activations (with x and y, SEM) relative to bregma. B1, Response (maximum ΔF/F) for hindlimb stimulation. Right upper box represents normalized curves. Right bottom box represents averaged value of all animals. B2, Thick line indicates profile of fluorescence in ROI within the contralateral HLS1 (red represents with stimulation; blue represents without stimulation) and ipsilateral S1 (green). Thin line indicates SEM. Gray background represents the window of stimulation. C, Response and profile for forelimb stimulation. D, Response and profile for whisker stimulation within the contralateral barrel cortex (BCS1; red represents with stimulation; blue represents without stimulation) and area M1 (green). In this example, stimulation was performed using piezo-stimulator touching a group of whiskers. Following the large positive responses were a >2 s undershoot (ΔF/F = −0.15 ± 0.06% for WS, 0.12 ± 0.05% for HL, and 0.09 ± 0.05% for FL stimulation) that could be attributed to either changes in cerebral blood volume or delayed inhibition. The undershoot was only consistently observed with WS stimulation and did not affect our mapping because it is based on relatively faster fluorescence changes. E, Location of responses for hindlimb (red), forelimb (green), and whisker stimulation (blue) overlaid on the basal GCaMP fluorescence. Gray dotted line indicates the putative homunculus (somatotopy) in left area S1. F, Profile of fluorescence for FL stimulation in another experiment (red represents with stimulation; blue represents without stimulation) presented for two different frame rates (left, 150 Hz; right, 10 Hz). Thick black line indicates single trial response.
Figure 3.
Figure 3.
Longitudinal recording of sensory response. A, Top, Representative example of basal GCaMP fluorescence through an 8-mm-wide coverslip chronic window exposing ∼50 mm2 of cortex during 10 consecutive weeks in one mouse. Bottom, Contralateral normalized responses for HL (red), FL (green), and WS (blue) stimulation. B, Response (amplitude normalized by the maximal amplitude observed during the period) for WS (blue), FL (green), and HL (red) stimulation during the 10 consecutive weeks (n = 2 mice). C, Error (see Materials and Methods) between sensory map of the first week and the 10 consecutive weeks (thin lines indicate SEM; n = 14).
Figure 4.
Figure 4.
Sensory response recorded through an acute unilateral craniotomy. A, Diagram of the acute craniotomy in a coronal section of the head and green reflectance image. B, Diagram of the dual calcium/IOS imaging setup. Red (630 nm) and blue (480 nm) LEDs were used to illuminate the cortex. Collected light passed through a 560 dichroic filter. Green fluorescence was then filtered with a bandpass green filter (530 nm), whereas the IOS signal was filtered with a long pass red filter (590 nm). C1, Calcium and IOS responses (Z-score) for hindlimb stimulation (1 s train of 1 ms pulses, 100 Hz). C2, Temporal profile of calcium fluorescence and IOS signal (expanded 10× for a better comparison with calcium signal profile) in ROI within the contralateral HLS1 (red represents with stimulation; blue represents without stimulation) and S2 (green). D, Same as in C, response and temporal profile for forelimb stimulation. E, Same as in C, D, response and temporal profile for ICMS within area S1 (100 ms train of 0.1 ms × 100 μA electric pulses, 400 Hz). F, Location of calcium responses for hindlimb (red) and forelimb (green) stimulation overlaid on the basal GCaMP fluorescence.
Figure 5.
Figure 5.
Region-specific spontaneous calcium activity. A, Calcium signal fluctuations recorded from three locations in the cortex (areas S1 and S2 and a reference region, indicated by the red, blue, and green crosses, respectively, in C. These data are collected during the same experiment presented in Figure 4. B1, Magnification of calcium signal in a temporal window. Each circle represents the location of an image presented in B2. IOS signal of the same temporal window. C, Calcium signals observed in each temporal location indicated in B1.
Figure 6.
Figure 6.
Long-range connections revealed by calcium spontaneous activity. A, Scatterplot of the calcium (left) and IOS signals (right) within the temporal window presented between signal of areas HLS1 (B, red cross) and S2 (blue cross: magenta dots) as well as between the reference region (green cross) and both areas HLS1 (yellow dots) and S2 (cyan dots). B, Seed pixel cross-correlation map based on calcium (right) and IOS signals (left). Location of the seed pixel: area S1HL indicated by the red cross, area S2 (blue cross), and reference pixel (green cross).
Figure 7.
Figure 7.
Consistency, duration, and frequency band of long-range correlated spontaneous activity mapping. A, Error (see Materials and Methods) between sensory map and seed pixel map recorded at different times ranging during 10 weeks (red curve, thin lines indicate SEM; n = 12). Dotted line indicates error observed in one animal with characteristic seed pixel correlation maps (for hindlimb location in area S1) for the first and last week presented above the graph with hindlimb sensory map used as a reference (left). B, Error between sensory map and seed pixel map for different recording durations ranging from 1.7 to 600 s (n = 10). Dotted line indicates error observed in one animal with characteristic seed pixel maps for 1.7, 9, 40, and 600 s recording durations presented above the graph with hindlimb sensory map used as a reference (left). Arrow indicates 9.1 s cutoff corresponding to −3 dB. C, Fourier transform of the calcium activity (gray lines indicate SEM; n = 10). D, Error between sensory map and seed pixel map for different frequency bands ranging from 0.005 to 5 Hz with characteristic seed pixel maps for 6 frequency bands indicated above the maps. Arrow indicates optimal frequency (n = 10); black horizontal bar represents −3 dB band cutoffs.
Figure 8.
Figure 8.
GCaMP Fluorescence is minimally affected by flavoprotein and blood volume artifact. A, B, Responses (maximum ΔF/F) and temporal profiles of green fluorescence for hindlimb stimulation (1 s train of 1 ms pulses, 100 Hz) and ICMS (1 s train of 0.1 ms × 100 μA electric pulses, 400 Hz) in a wild-type animal. Red curves represent profile of the example displayed. Black curves represent profile and SEM of the averaged response for all animals tested. C, Response and profile of green fluorescence for forelimb stimulation in a GFP mouse. D, Left, Spontaneous fluctuations of green fluorescence of Emx-GCaMP (red, n = 2), wild-type (black, n = 1), and GFP mice (green, n = 2). Right, Close-up of 60 s of recording after DC value subtracted. E, F, Seed pixel cross-correlation map calculated on wild-type and GFP mice.
Figure 9.
Figure 9.
Spontaneous activity mapping of functional connections. A1, Seed pixel cross-correlation maps associated with 3 seed pixel locations (black crosses) within area S1 through a bilateral chronic window. A2, Location of the 3 cross-correlation thresholded activity (in red, green, and blue) overlaid on the basal GCaMP fluorescence. B, Same as A, but for seed pixel locations within area M1. C, D, Same as A, B but for unilateral acute craniotomy and seed pixel locations within areas S1 (C) or S2 (D).
Figure 10.
Figure 10.
Cortical stimulation mapping of functional connections. A1, Calcium responses (maximum ΔF/F) for cortical stimulation (ICMS) in three different locations of area S1 through a bilateral acute craniotomy. A2, Location of thresholded functional responses (in red, green, and blue) overlaid on the basal GCaMP fluorescence. Contralateral responses being lower than the threshold, they do not appear on these thresholded images. B, Calcium responses in area S2 for cortical stimulations in three different locations of area S1 through a unilateral acute craniotomy.

References

    1. ABI Mouse Connectivity. Emx1-IRES-Cre;Ai38. 2014. Available at: http://connectivity.brain-map.org/transgenic/experiment/100132540. Retrieved on October 27, 2014.
    1. Ackman JB, Burbridge TJ, Crair MC. Retinal waves coordinate patterned activity throughout the developing visual system. Nature. 2012;490:219–225. doi: 10.1038/nature11529. - DOI - PMC - PubMed
    1. Akemann W, Mutoh H, Perron A, Park YK, Iwamoto Y, Knöpfel T. Imaging neural circuit dynamics with a voltage-sensitive fluorescent protein. J Neurophysiol. 2012;108:2323–2337. doi: 10.1152/jn.00452.2012. - DOI - PubMed
    1. Akemann W, Sasaki M, Mutoh H, Imamura T, Honkura N, Knöpfel T. Two-photon voltage imaging using a genetically encoded voltage indicator. Sci Rep. 2013;3:2231. doi: 10.1038/srep02231. - DOI - PMC - PubMed
    1. Akerboom J, Chen TW, Wardill TJ, Tian L, Marvin JS, Mutlu S, Calderón NC, Esposti F, Borghuis BG, Sun XR, Gordus A, Orger MB, Portugues R, Engert F, Macklin JJ, Filosa A, Aggarwal A, Kerr RA, Takagi R, Kracun S, et al. Optimization of a GCaMP calcium indicator for neural activity imaging. J Neurosci. 2012;32:13819–13840. doi: 10.1523/JNEUROSCI.2601-12.2012. - DOI - PMC - PubMed

Publication types