Randomized Controlled Trial
. 2014 Nov 26;34(48):16117-25.
doi: 10.1523/JNEUROSCI.3474-13.2014.

Attentional modulation of alpha/beta and gamma oscillations reflect functionally distinct processes

Affiliations
Randomized Controlled Trial

Attentional modulation of alpha/beta and gamma oscillations reflect functionally distinct processes

Markus Bauer et al. J Neurosci. .

Abstract

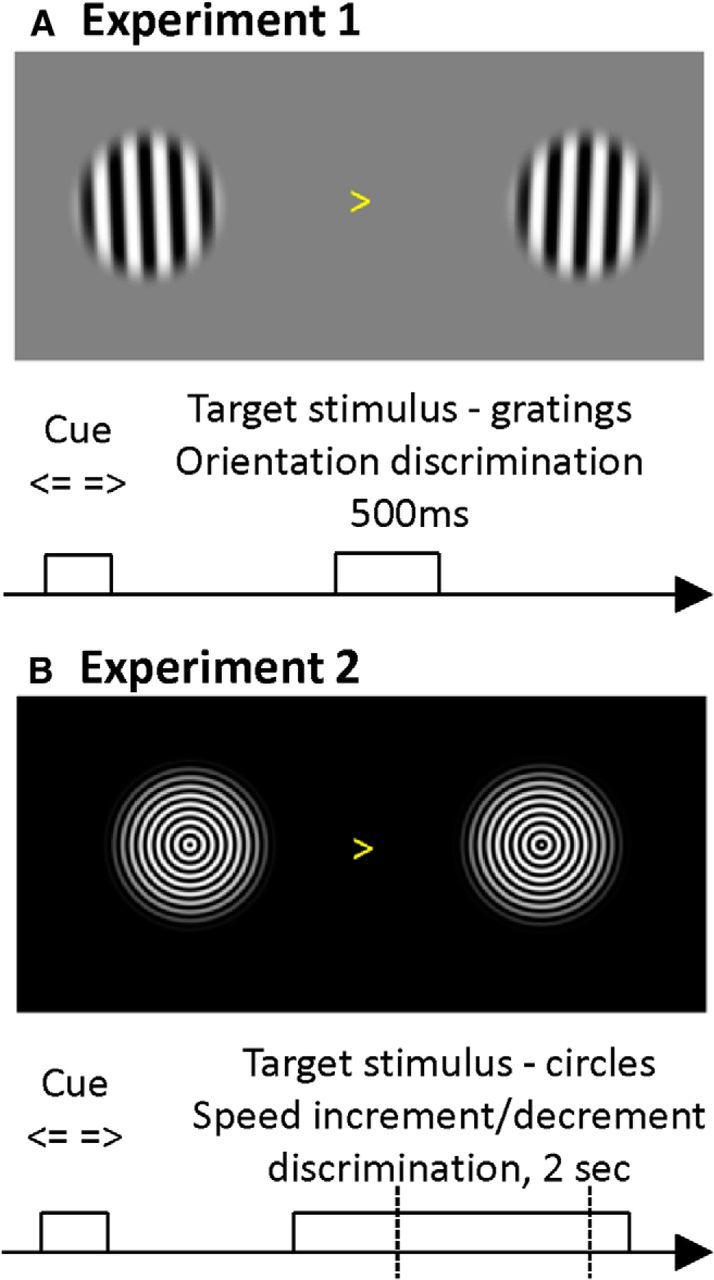
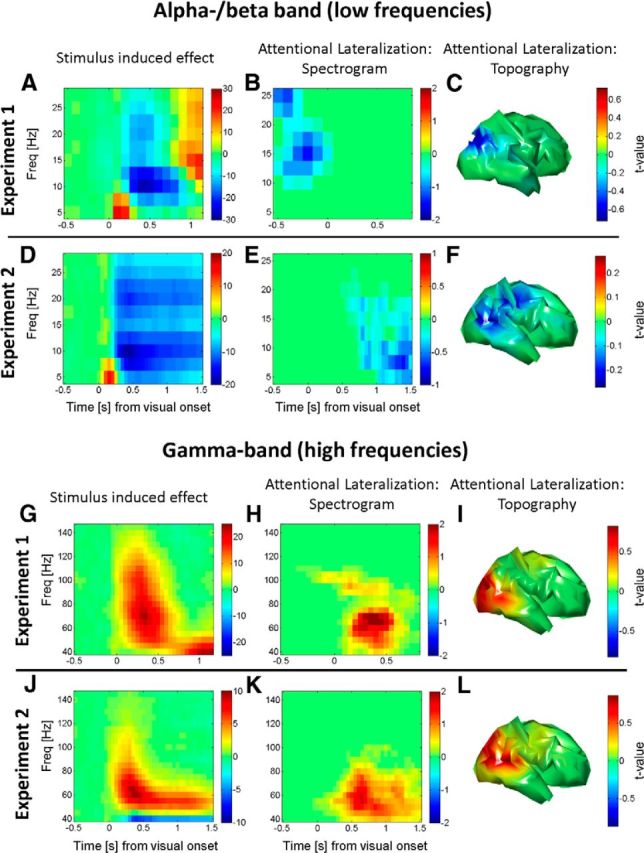
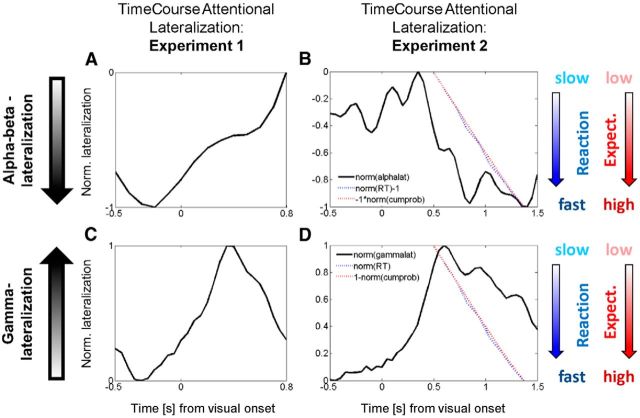
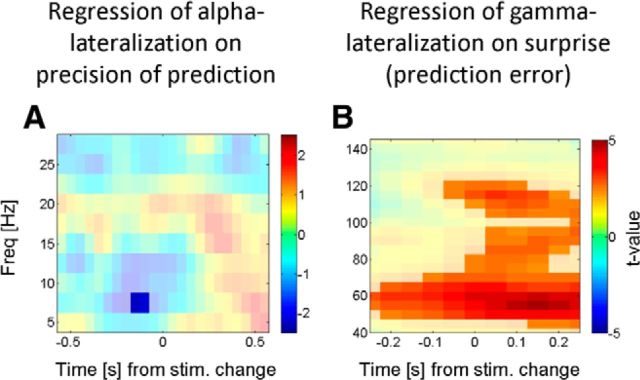
The brain adapts to dynamic environments by adjusting the attentional gain or precision afforded to salient and predictable sensory input. Previous research suggests that this involves the regulation of cortical excitability (reflected in prestimulus alpha oscillations) before stimulus onset that modulates subsequent stimulus processing (reflected in stimulus-bound gamma oscillations). We present two spatial attention experiments in humans, where we first replicate the classic finding of prestimulus attentional alpha modulation and poststimulus gamma modulation. In the second experiment, the task-relevant target was a stimulus change that occurred after stimulus onset. This enabled us to show that attentional alpha modulation reflects the predictability (precision) of an upcoming sensory target, rather than an attenuation of alpha activity induced by neuronal excitation related to stimulus onset. In particular, we show that the strength of attentional alpha modulations increases with the predictability of the anticipated sensory target, regardless of current afferent drive. By contrast, we show that the poststimulus attentional gamma enhancement is stimulus-bound and decreases when the subsequent target becomes more predictable. Hence, this pattern suggests that the strength of gamma oscillations is not merely a function of cortical excitability, but also depends on the relative mismatch of predictions and sensory evidence. Together, these findings support recent theoretical proposals for distinct roles of alpha/beta and gamma oscillations in hierarchical perceptual inference and predictive coding.

Keywords: alpha; attention; gamma; magnetoencephalography; oscillations; predictive coding.


Figures

Figure 1.
Figure 1.
Experimental task. A, Experiment 1 subjects had to report the deviation of a precued grating from the vertical orientation (clockwise vs counter-clockwise) by button press. The deterministic cue appeared with a variable interstimulus interval of 1300–1700 ms before the simultaneous presentation of both gratings and was followed by fixation, so the grating and cue were never presented simultaneously. B, In experiment 2, two sets of concentric gratings contracting toward the fixation point shown after a centrally presented (likewise deterministic) cue instructed participants to focus on the left or right hemifield (variable cue stimulus interstimulus interval of 1000–1500 ms). A speed change target occurred between 382 and 1362 ms following stimulus onset, and participants had to report whether the precued grating changed to a faster or slower speed.
Figure 2.
Figure 2.
Stimulus- and attention-related modulation of oscillatory activity. The first column shows a time–frequency spectrum of the stimulus-induced “event-related desynchronization.” The second column shows thresholded time–frequency-resolved statistical parametric maps for attentional lateralization, for combined cortical hemispheres and corrected for multiple comparisons across time, space, and frequency. The third column shows the brain topographies (hemispheric asymmetries) of these lateralized attentional effects corrected for multiple comparisons (low frequencies). A, In experiment 1, alpha and beta activity in occipital cortex are suppressed after the onset of the stimulus (t = 0). The grand-averaged baseline normalized response (averaged z values for the within-subject comparison of peristimulus events and baseline) is shown. B, Suppression of prestimulus alpha/beta activity in the hemisphere contralateral to the attended hemifield. Note that significant attentional modulation is restricted to the prestimulus period, in the absence of visual stimulation, and while alpha oscillations are stronger. The spectra are averaged across all cortical vertices that show whole brain (hemisphere)-corrected significant modulations. C, Topography of this effect (averaged across all significant time–frequency windows) shows that the suppression of alpha-beta power is dominant in the parieto-occipital area, contralateral to the attended hemifield (combined left and right). D, In experiment 2, as in A, alpha and beta oscillations in occipital cortex are suppressed after stimulus onset (of the moving concentric circles), showing the typical effect of stimulation on low-frequency oscillations. E, Suppression of contralateral alpha-beta activity, as in B, but notice here that the (cluster level-significant) attentional modulation is in the poststimulus period during strong afferent stimulation. This does not imply that there is no prestimulus modulation, but that modulation is predominant in the poststimulus period. F, Topography of this effect (all significant time–frequency windows) now spreading toward more temporal areas and TPJ as well as premotor areas (high frequencies). G, In experiment 1, gamma activity in occipital cortex is enhanced after onset of the grating stimulus (t = 0). Shown is the grand-averaged baseline normalized response (averaged z values for the within-subject comparison of peristimulus events and baseline). H, Enhancement of poststimulus gamma activity in the hemisphere contralateral to the attended hemifield. Attentional modulation peaks in the poststimulus period. I, This contralateral enhancement is predominantly found in occipital and occipitotemporal cortex. J, In experiment 2, similar to G, stimulus onset induces enhanced gamma oscillations, as described previously. K, Likewise, contralateral gamma enhancement by spatial selective attention. There is no qualitative shift here. L, Contralateral enhancement, similar to that in I. Freq, Frequency.
Figure 3.
Figure 3.
Time course of attentional lateralization, expectancy, and behavior. A, Experiment 1. The time course of the normalized lateralization index for alpha/beta-power is shown for the static gratings. Negative values indicate stronger contralateral alpha/beta-suppression (both A and B); these are predominantly found in the pre-stimulus period and then return to baseline. B, Experiment 2. Likewise, this shows the time course of normalized attentional lateralization for alpha/beta-oscillations, now for the dynamic stimuli. All measures shown in A and B are normalized to range between 0 (smallest magnitude) and −1 (greatest magnitude) for better visual comparison. For RT (blue), negative values indicate fast responses (norm[RT]−1) and for cumulative probability (red), negative values reflect high probability (−1*norm[cumprob]). Attentional lateralization in Experiment 2 is already present in the pre-stimulus period but reaches its peak towards the end of the trial. The comparison between measures reveals that as the cumulative probability for a target increases, the magnitude of attentional alpha suppression increases and participants respond more quickly. C, Experiment 1. The normalized time course of gamma-lateralization is shown. Here (both C and D), larger positive values indicate higher magnitude of attentional gamma enhancement. D, Experiment 2. Importantly, a different scaling of the y-axis (now from 0 to +1) compared to Fig. 3B is used here, for visual alignment of the measures, while the graphical slopes of RT and probability remain the same. Here, more positive lateralization values indicate greater attentional modulation and the probability is now plotted as (1-norm[cumprob]), or ‘surprise’. Hence, ‘1’ indicates low probability (high surprise) and ‘0’ indicates high probability (low surprise). Reaction time is displayed as normalized positive RT (i.e., ‘0’ indicates fast responses). High gamma lateralization is therefore correlated with a state of high surprise, rather than high expectancy (contrary relationship to B). B and D thus reveal that temporal expectancy determines the strength of alpha/beta- and gamma-lateralization, but their relationship is of opposite nature: alpha/beta correlates positively with expectancy, gamma with its complement, surprise or prediction error.
Figure 4.
Figure 4.
Oscillatory dynamics locked to the target speed change. Here we investigate how attentional lateralization develops as a function of time during the trial (and therefore cumulative probability) when considering in experiment 2 the attentional lateralization time locked to the target (speed change, time 0). Individual trials were binned according to the stimulus target SOA (linearly related to cumulative probability). A shows the t values of the regression coefficients when regressing contralateral alpha suppression on the cumulative probability of speed change. Blue values indicate stronger contralateral alpha suppression with increasing probability. Note that the temporal dynamics here follow the pattern typically observed of a prestimulus alpha lateralization, that is, attenuated after stimulus onset. This indicates that alpha lateralization indeed tracks the predictability of an upcoming target. B shows the t values of the coefficients when regressing contralateral gamma enhancement on 1-cumulative probability (i.e., the prediction error). Red values indicate larger gamma lateralization with larger prediction error. This and the poststimulus expression of this effect support the hypothesis that gamma oscillations may serve as a feedforward update signal in a predictive coding context. stim., Stimulus; Freq, frequency.
Figure 5.
Figure 5.
Correlation of RT with strength of gamma oscillations. The figure shows the t statistic of the regression of occipital gamma activity on reaction times, when the entire reaction time variance is taken into account (in contrast to Fig. 3, which was averaged across trials within the same stimulus target SOA bin). Negative t values indicate a negative relationship between power-spectral-density and reaction time; hence, the graph confirms that larger gamma power corresponds to shorter reaction times (faster responses) when the total variation was taken into account, confirming previous findings. stim, Stimulus; stat, statistic; Freq, frequency.

References

    1. Arnal LH, Giraud AL. Cortical oscillations and sensory predictions. Trends Cogn Sci. 2012;16:390–398. doi: 10.1016/j.tics.2012.05.003. - DOI - PubMed
    1. Bastos AM, Usrey WM, Adams RA, Mangun GR, Fries P, Friston KJ. Canonical microcircuits for predictive coding. Neuron. 2012;76:695–711. doi: 10.1016/j.neuron.2012.10.038. - DOI - PMC - PubMed
    1. Bauer M. Nijmegen, The Netherlands: F.C. Donders Centre for Cognitive Neuroimaging, Radboud University; 2008. Functional roles of rhythmic neuronal activity in the human visual and somatosensory system. PhD Thesis.
    1. Bauer M, Oostenveld R, Peeters M, Fries P. Tactile spatial attention enhances gamma-band activity in somatosensory cortex and reduces low-frequency activity in parieto-occipital areas. J Neurosci. 2006;26:490–501. doi: 10.1523/JNEUROSCI.5228-04.2006. - DOI - PMC - PubMed
    1. Bauer M, Oostenveld R, Fries P. Tactile stimulation accelerates behavioral responses to visual stimuli through enhancement of occipital gamma-band activity. Vision Res. 2009;49:931–942. doi: 10.1016/j.visres.2009.03.014. - DOI - PubMed

Publication types