. 2014 Oct 1;4(10):3845-3852.
doi: 10.1039/C4SC01392A.

Caspase-responsive smart gadolinium-based contrast agent for magnetic resonance imaging of drug-induced apoptosis

Affiliations

Caspase-responsive smart gadolinium-based contrast agent for magnetic resonance imaging of drug-induced apoptosis

Deju Ye et al. Chem Sci. .

Abstract

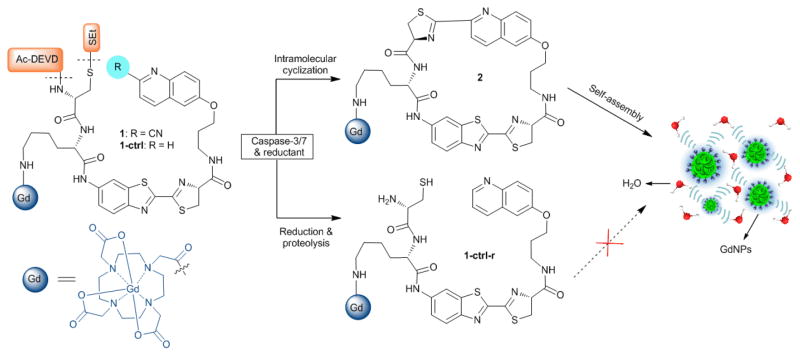
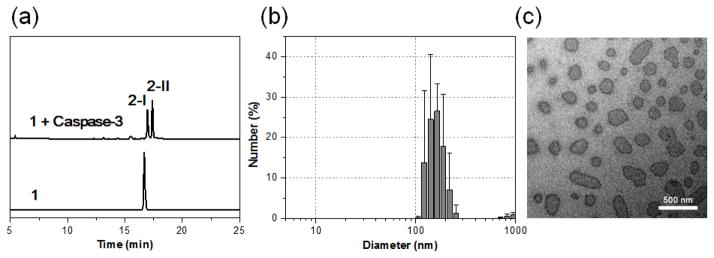
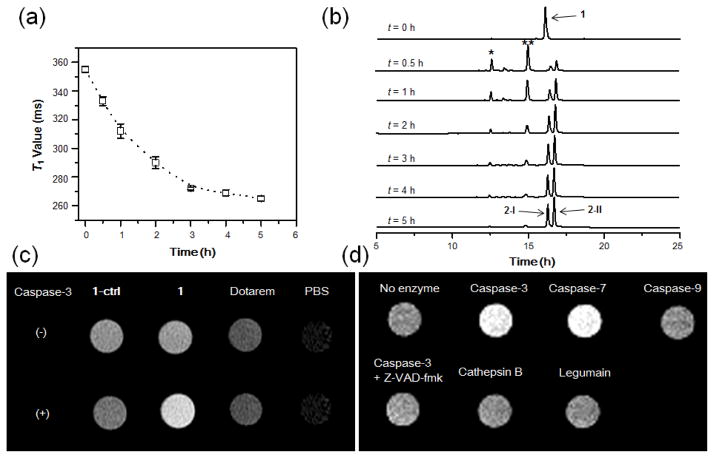
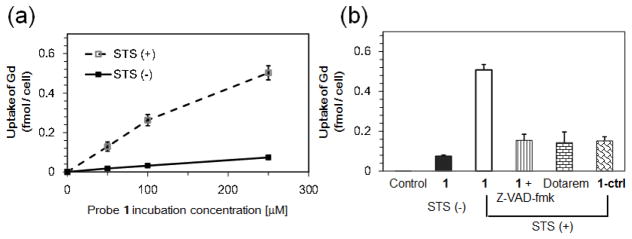
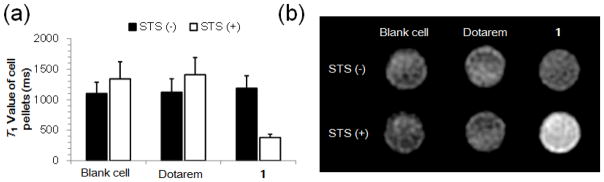
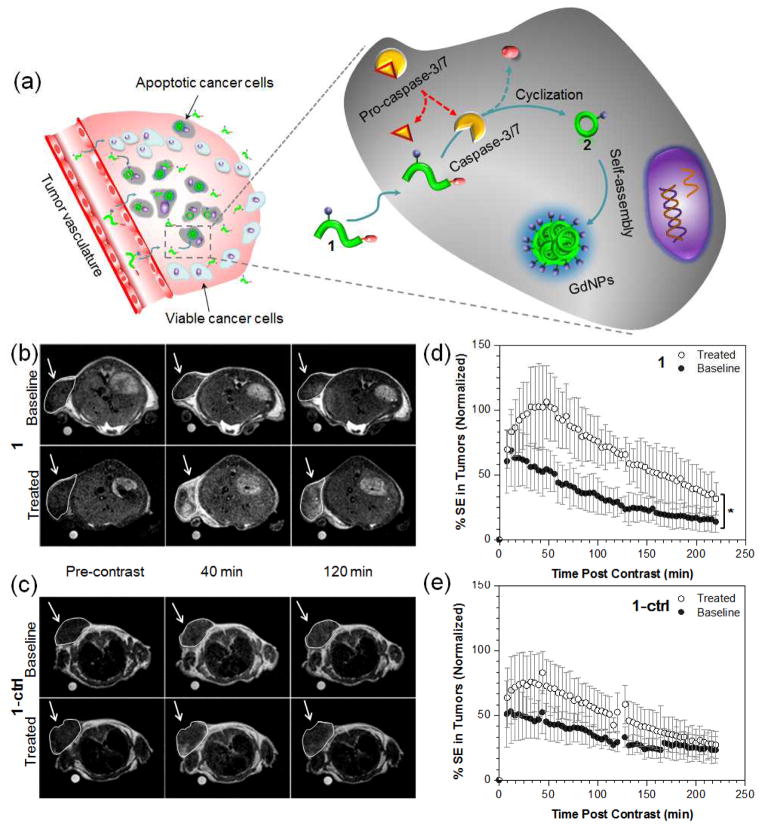
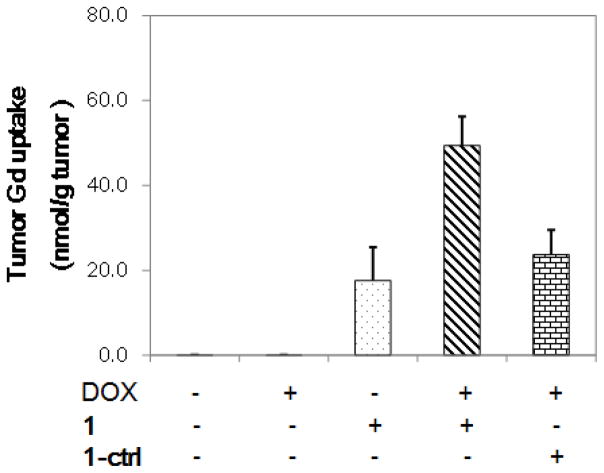
Non-invasive detection of caspase-3/7 activity in vivo has provided invaluable predictive information regarding tumor therapeutic efficacy and anti-tumor drug selection. Although a number of caspase-3/7 targeted fluorescence and positron emission tomography (PET) imaging probes have been developed, there is still a lack of gadolinium (Gd)-based magnetic resonance imaging (MRI) probes that enable high spatial resolution detection of caspase-3/7 activity in vivo. Here we employ a self-assembly approach and develop a caspase-3/7 activatable Gd-based MRI probe for monitoring tumor apoptosis in mice. Upon reduction and caspase-3/7 activation, the caspase-sensitive nano-aggregation MR probe (C-SNAM: 1) undergoes biocompatible intramolecular cyclization and subsequent self-assembly into Gd-nanoparticles (GdNPs). This results in enhanced r1 relaxivity-19.0 (post-activation) vs. 10.2 mM-1 s-1 (pre-activation) at 1 T in solution-and prolonged accumulation in chemotherapy-induced apoptotic cells and tumors that express active caspase-3/7. We demonstrate that C-SNAM reports caspase-3/7 activity by generating a significantly brighter T1-weighted MR signal compared to non-treated tumors following intravenous administration of C-SNAM, providing great potential for high-resolution imaging of tumor apoptosis in vivo.


Figures

Fig. 1
Fig. 1
The chemical structures of probe C-SNAM (1) and its control probe 1-ctrl, and the proposed chemical conversions following disulfide reduction and caspase-3/7-triggered DEVD peptide cleavage.
Fig. 2
Fig. 2
Caspase-3 mediated macrocyclization and self-assembly into GdNPs in vitro. (a) HPLC traces of 1 (bottom) and the incubation of 1 (200 μM) with recombinant human caspase-3 (50 nM) in the caspase buffer at 37 °C for 5 h (top). (b) DLS analysis of 1 (200 uM) following incubation with caspase-3 (50 nM) in caspase buffer (pH 7.4) overnight. Error bars indicated standard deviation, coming from three repeated measurements. (c) TEM images of GdNPs formed in the solution shown in (b). Scale bar: 500 nm.
Fig. 3
Fig. 3
MR studies with 1 in vitro. (a) Time-dependent T1 value reduction of 1 (200 μM) in the presence of caspase-3 (40 nM) in enzyme reaction buffer at 37 °C. T1 value (1 T) at each time point was measured with Bruker Minispec (mq40 NMR analyzer) at 37 °C, using the standard inversion recovery program. Data represent mean values ± standard deviation, n = 2. (b) HPLC traces of 1 (200 μM) upon incubation with caspase-3 (40 nM) from 0 to 5 h. Peaks * and ** indicate disulfide reduced intermediates of 1. (c) T1-weighted images show brighter MR signal for 1 than other probes upon caspase-3 incubation. MR probes 1, 1-ctrl, and Dotarem at 75 μM in enzyme reaction buffer were incubated with and without caspase-3 (20 nM) at 37 °C overnight. T1-weighted spin-echo images (TE/TR = 11/900 ms) of the incubation solutions were acquired at 1.5 T at 37 °C. (d) Brighter T1-weighted images of 1 were produced by caspase-3/7 than other enzymes. Probe 1 (208 μM) was incubated with indicated protease (50 nM) in enzyme reaction buffer (pH 7.4) at 37 °C overnight. T1-weighted spin-echo images (TE/TR = 15/150 ms) of the incubation solutions were acquired at 1 T at r.t.
Fig. 4
Fig. 4
Cell uptake studies with 1. (a) ICP-MS analysis of Gd uptake in viable and STS-induced apoptotic HeLa cells with 1. HeLa cells were untreated or treated with 2 μM STS for 4 h, and then incubated with 0, 50, 100, and 250 μM of 1 for 24 h. After incubation, the cell pellets were collected, washed with PBS, and digested with 69% HNO3. The uptake of Gd in cells was obtained from ICP-MS analysis, and normalized to cell number. Each data point and error bar represents the mean and standard deviation of three experiment results. (b) ICP-MS analysis of Gd uptake in apoptotic HeLa cells with different Gd-based MRI probes at 250 μM for 24 h. Each data point and error bar represents the mean and standard deviation of three experimental results.
Fig. 5
Fig. 5
MR studies of cell incubating with 1. (a) T1 values (1 T) of viable and apoptotic HeLa cell pellets after incubation with 250 μM of 1 or Dotarem for 24 h. (b) T1-weighted MR images (3T, TE/TR = 30/100 ms) of viable and apoptotic HeLa cell pellets after incubation with 250 μM 1 or Dotarem for 24 h.
Fig. 6
Fig. 6
Non-invasive MR imaging of tumor cell death in mice. (a) The proposed mechanism of 1 for in vivo MR imaging of caspase-3/7 activity in a chemotherapy-responsive tumor. (b, c) Representative T1-weighted MR images (1T) of HeLa tumors prior to (baseline) or following treatment with DOX (treated). Images were obtained before (pre-contrast), 40 and 120 min after i.v. injection of 0.1 mmol/kg of 1 (b) or 1-ctrl (c). (d, e) The average longitudinal % signal enhancement (% SE) in baseline (●) and treated (○) tumors after i.v. injection of 1 (n = 8, c) or 1-ctrl (n = 4, d) at 0.1 mmol/kg dose. The tumor signal intensity(SI) was normalized to the reference standard in a mini-NMR tube (1 mM of Dotarem in PBS), and % SE was calculated at each time point as the % difference between the tumor SI at that time point and the tumor SI in the pre-contrast (t = 0) dataset. * p < 0.05. Error bars are standard deviation.
Fig. 7
Fig. 7
ICP-MS analysis of tumor Gd uptake. Mice bearing subcutaneous HeLa tumors were untreated or treated with DOX (0.2 mg × 2). After treatment, 1 or 1-ctrl (0.1 mmol kg−1) was injected i.v., and the mice were sacrificed after 1 h. The tumors were resected, weighted, and digested with 69% HNO3. The total Gd amount was analyzed by ICP-MS, and the tumor Gd uptake was normalized to tumor weight. Each data point and error bar represents the mean and standard deviation of 5 mice.

Similar articles

Cited by

References

    1. Shen C, New EJ. Curr Opin Chem Biol. 2013;17:158–166. - PubMed
    1. Que EL, Chang CJ. Chem Soc Rev. 2009;39:51–60. - PubMed
    1. De Leon-Rodriguez LM, Lubag AJ, Malloy CR, Martinez GV, Gillies RJ, Sherry AD. Acc Chem Res. 2009;42:948–957. - PMC - PubMed
    1. Major JL, Meade TJ. Acc Chem Res. 2009;42:893–903. - PMC - PubMed
    1. Que EL, New EJ, Chang CJ. Chem Sci. 2012;3:1829–1834. - PMC - PubMed