

Features of CPB: a Poisson-Boltzmann solver that uses an adaptive Cartesian grid
- PMID: 25430617
- PMCID: PMC4314402
- DOI: 10.1002/jcc.23791
Features of CPB: a Poisson-Boltzmann solver that uses an adaptive Cartesian grid
Abstract
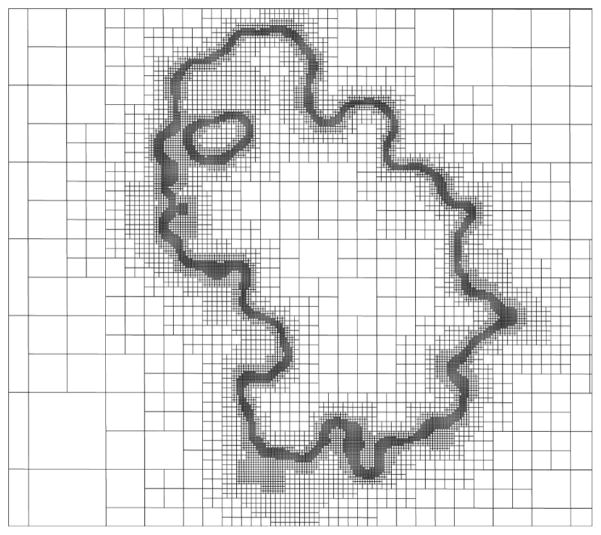
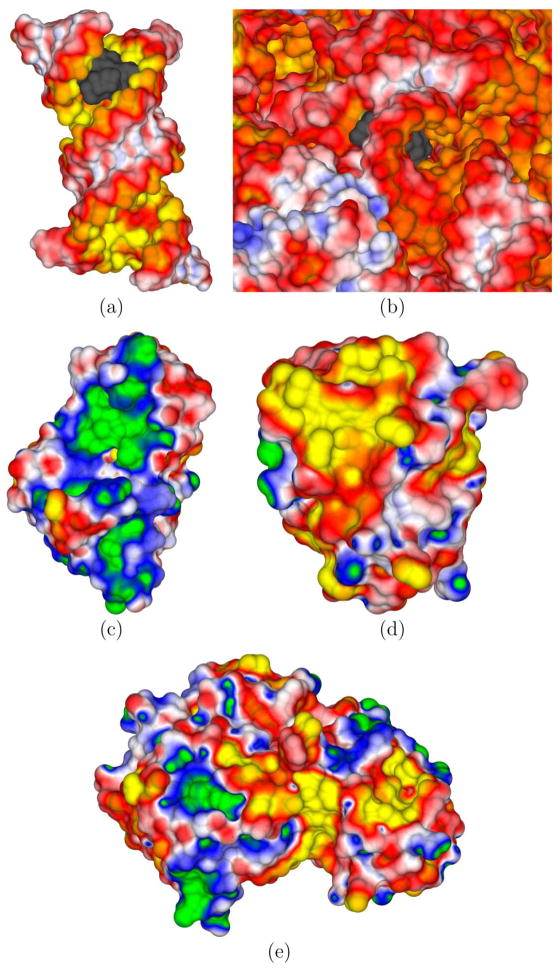
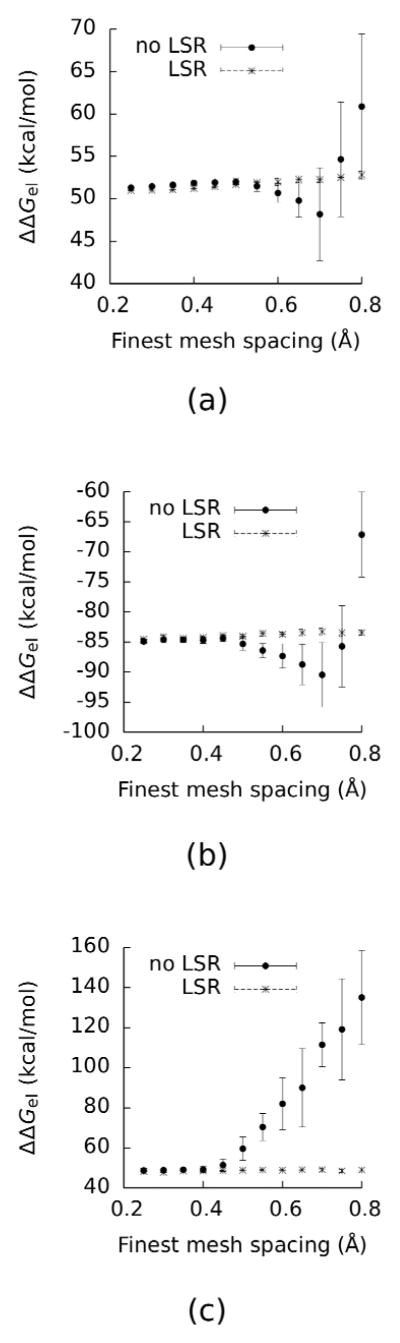
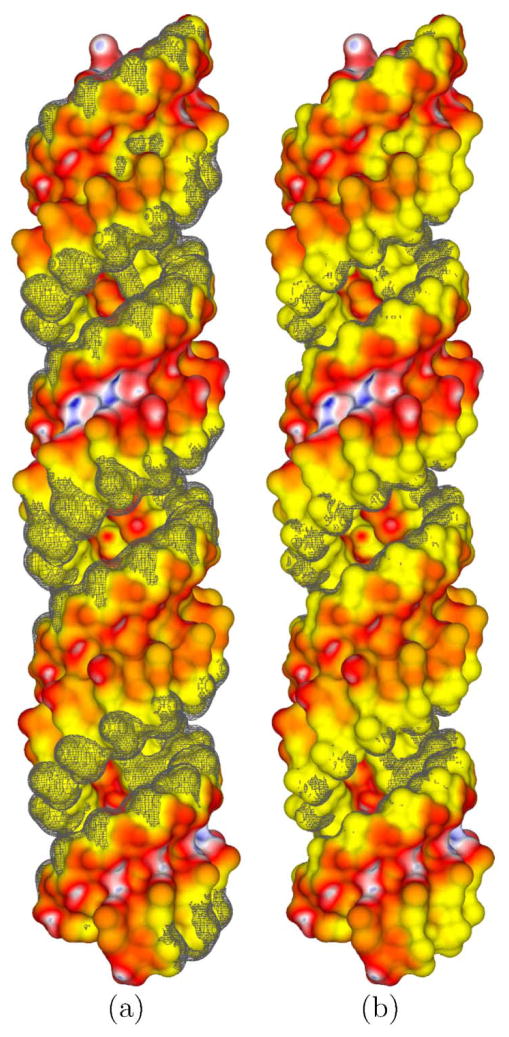
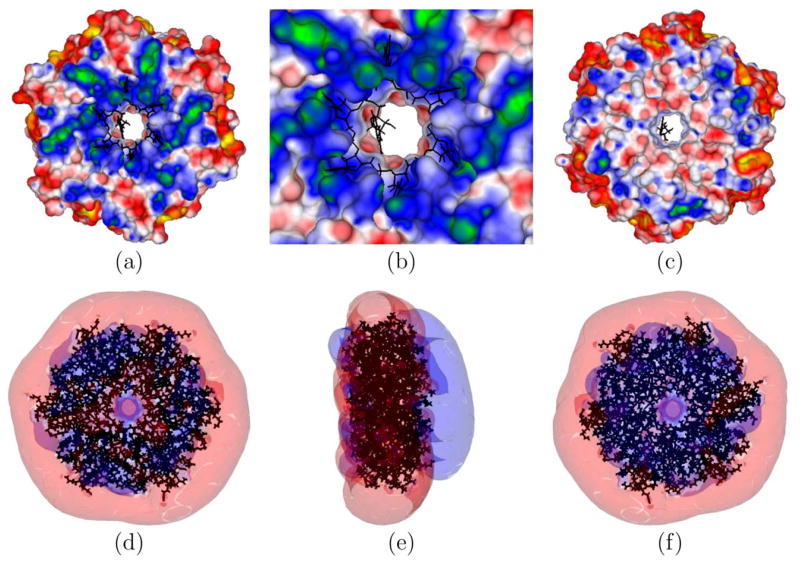
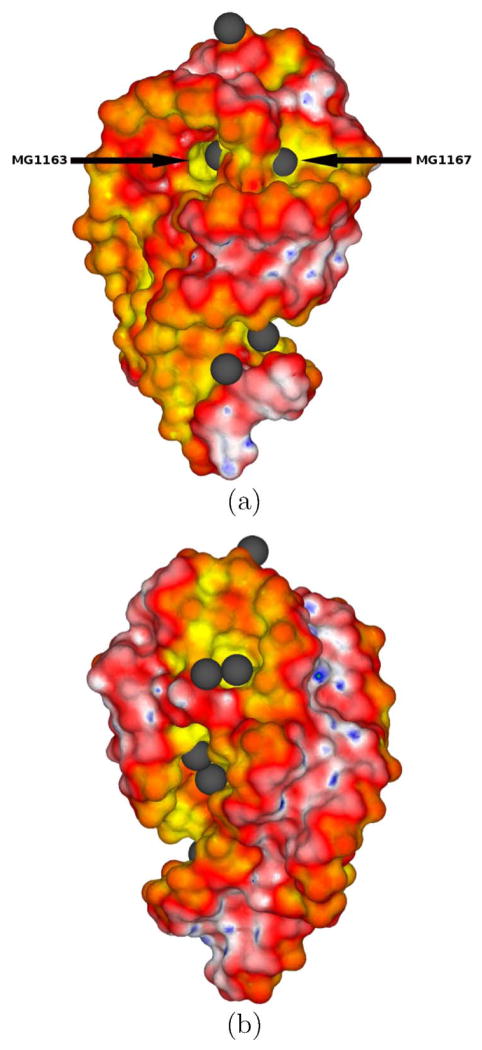
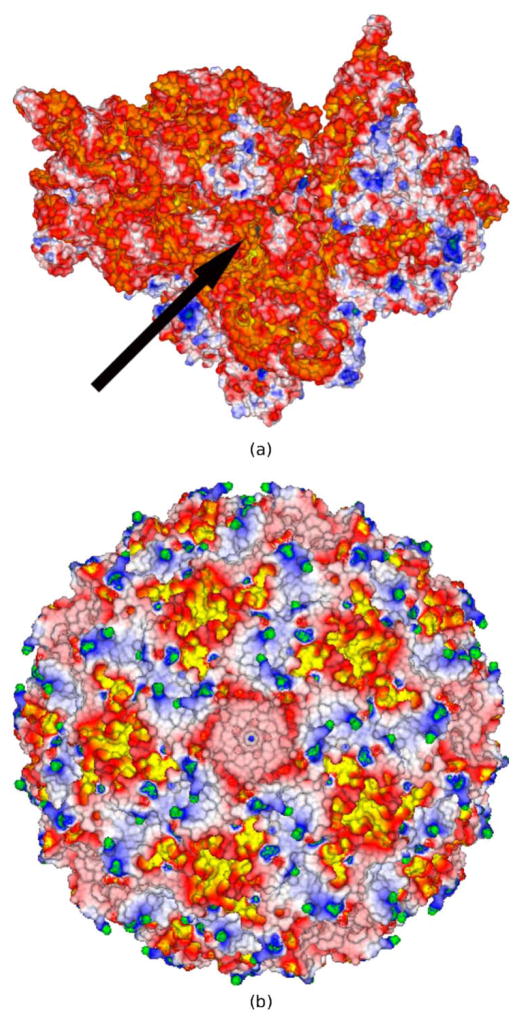
The capabilities of an adaptive Cartesian grid (ACG)-based Poisson-Boltzmann (PB) solver (CPB) are demonstrated. CPB solves various PB equations with an ACG, built from a hierarchical octree decomposition of the computational domain. This procedure decreases the number of points required, thereby reducing computational demands. Inside the molecule, CPB solves for the reaction-field component (ϕrf ) of the electrostatic potential (ϕ), eliminating the charge-induced singularities in ϕ. CPB can also use a least-squares reconstruction method to improve estimates of ϕ at the molecular surface. All surfaces, which include solvent excluded, Gaussians, and others, are created analytically, eliminating errors associated with triangulated surfaces. These features allow CPB to produce detailed surface maps of ϕ and compute polar solvation and binding free energies for large biomolecular assemblies, such as ribosomes and viruses, with reduced computational demands compared to other Poisson-Boltzmann equation solvers. The reader is referred to http://www.continuum-dynamics.com/solution-mm.html for how to obtain the CPB software.
Keywords: Poisson-Boltzmann equation; adaptive Cartesian grid; electrostatic potential; electrostatics; implicit solvent model; surface.
© 2014 Wiley Periodicals, Inc.
Figures
Similar articles
-
A Fast and Robust Poisson-Boltzmann Solver Based on Adaptive Cartesian Grids.J Chem Theory Comput. 2011 May 10;7(5):1524-1540. doi: 10.1021/ct1006983. J Chem Theory Comput. 2011. PMID: 21984876 Free PMC article.
-
Numerical Difficulties Computing Electrostatic Potentials Near Interfaces with the Poisson-Boltzmann Equation.J Chem Theory Comput. 2017 Aug 8;13(8):3945-3951. doi: 10.1021/acs.jctc.7b00487. Epub 2017 Jul 17. J Chem Theory Comput. 2017. PMID: 28640608
-
Treatment of geometric singularities in implicit solvent models.J Chem Phys. 2007 Jun 28;126(24):244108. doi: 10.1063/1.2743020. J Chem Phys. 2007. PMID: 17614538
-
Electrostatics calculations: latest methodological advances.Curr Opin Struct Biol. 2006 Apr;16(2):142-51. doi: 10.1016/j.sbi.2006.03.001. Epub 2006 Mar 15. Curr Opin Struct Biol. 2006. PMID: 16540310 Review.
-
The Poisson-Boltzmann equation for biomolecular electrostatics: a tool for structural biology.J Mol Recognit. 2002 Nov-Dec;15(6):377-92. doi: 10.1002/jmr.577. J Mol Recognit. 2002. PMID: 12501158 Review.
Cited by
-
Multiscale method for modeling binding phenomena involving large objects: application to kinesin motor domains motion along microtubules.Sci Rep. 2016 Mar 18;6:23249. doi: 10.1038/srep23249. Sci Rep. 2016. PMID: 26988596 Free PMC article.
-
Insights into DNA solvation found in protein-DNA structures.Biophys J. 2022 Dec 20;121(24):4749-4758. doi: 10.1016/j.bpj.2022.11.019. Epub 2022 Nov 14. Biophys J. 2022. PMID: 36380591 Free PMC article. Review.
-
Accuracy Comparison of Generalized Born Models in the Calculation of Electrostatic Binding Free Energies.J Chem Theory Comput. 2018 Mar 13;14(3):1656-1670. doi: 10.1021/acs.jctc.7b00886. Epub 2018 Feb 15. J Chem Theory Comput. 2018. PMID: 29378399 Free PMC article.
References
Publication types
MeSH terms
Substances
Grants and funding
LinkOut - more resources
Full Text Sources
Other Literature Sources
