

Protein-protein Interaction Networks of E. coli and S. cerevisiae are similar
- PMID: 25431098
- PMCID: PMC5384207
- DOI: 10.1038/srep07187
Protein-protein Interaction Networks of E. coli and S. cerevisiae are similar
Abstract
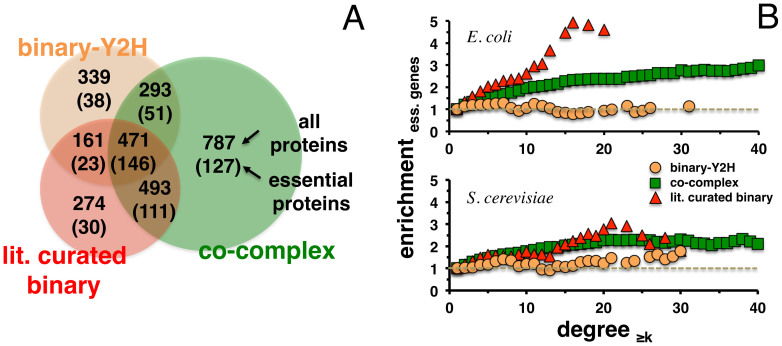
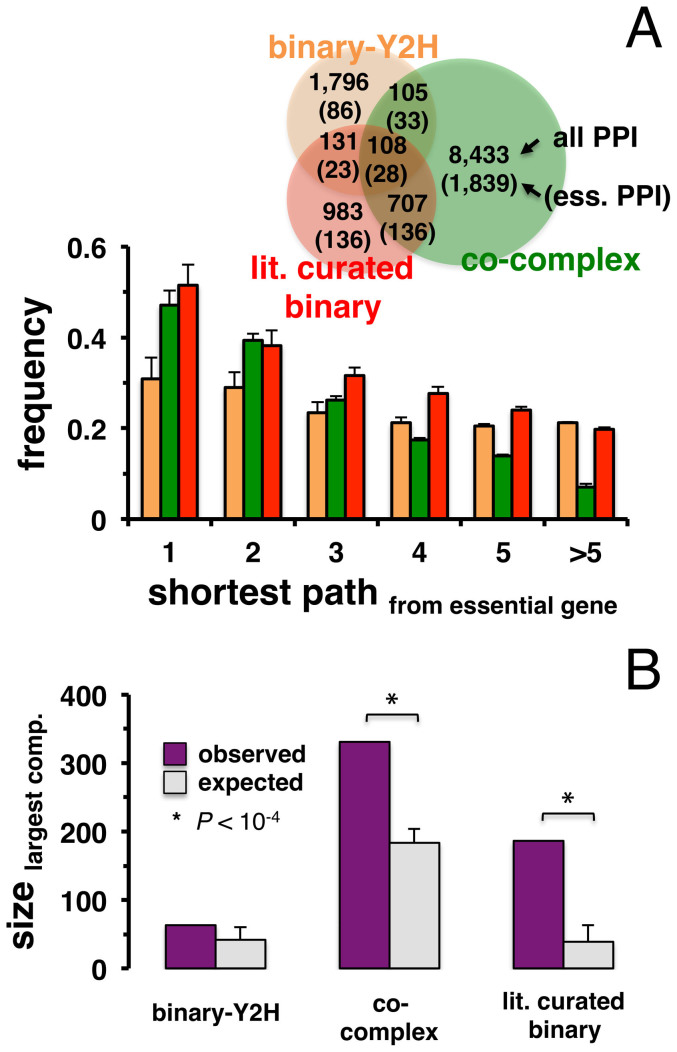
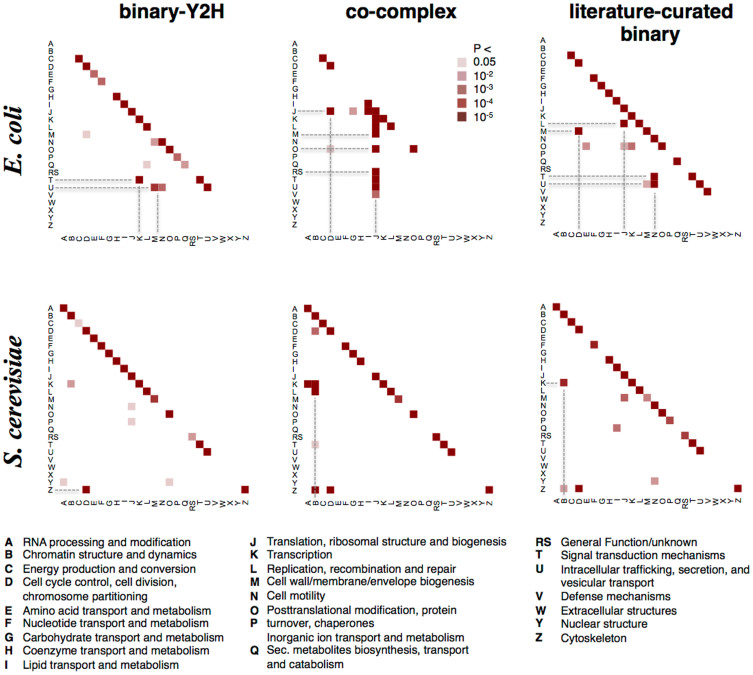
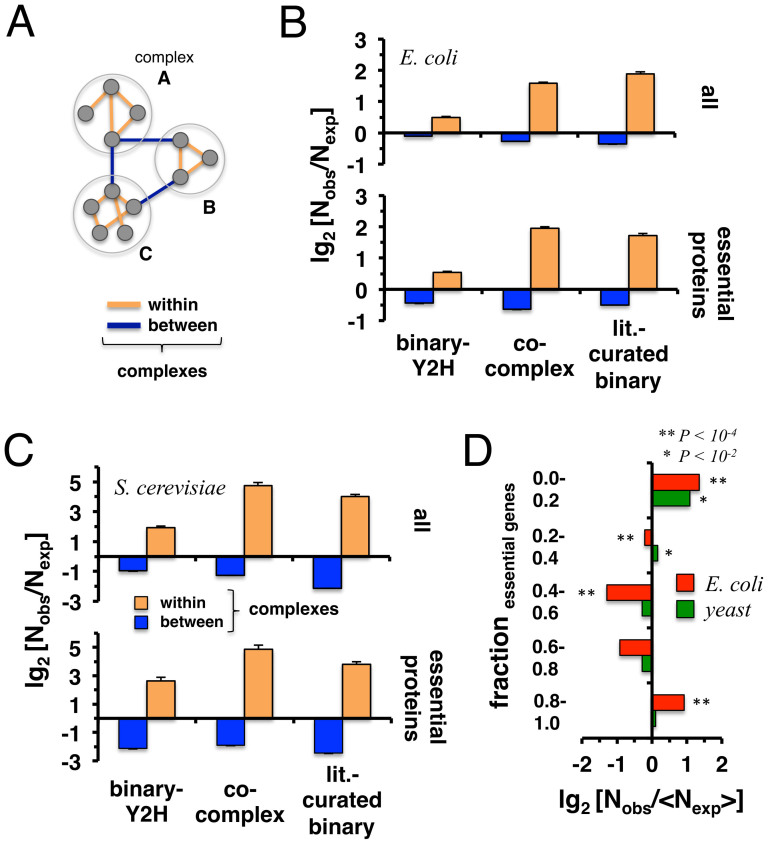
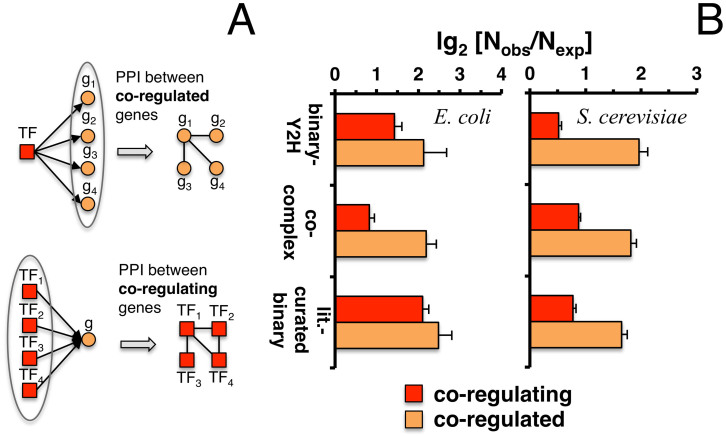
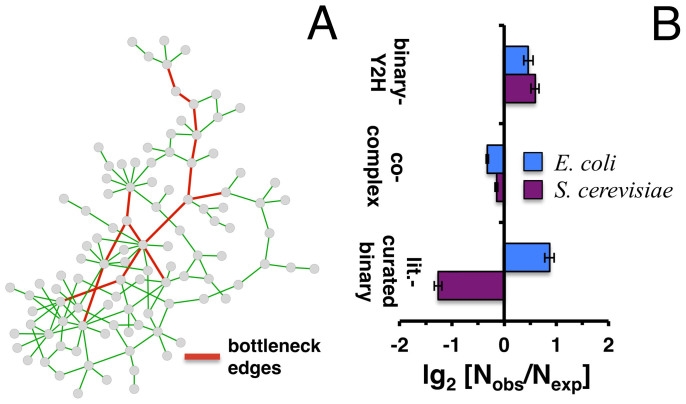
Only recently novel high-throughput binary interaction data in E. coli became available that allowed us to compare experimentally obtained protein-protein interaction networks of prokaryotes and eukaryotes (i.e. E. coli and S. cerevisiae). Utilizing binary-Y2H, co-complex and binary literature curated interaction sets in both organisms we found that characteristics of interaction sets that were determined with the same experimental methods were strikingly similar. While essentiality is frequently considered a question of a protein's increasing number of interactions, we found that binary-Y2H interactions failed to show such a trend in both organisms. Furthermore, essential genes are enriched in protein complexes in both organisms. In turn, binary-Y2H interactions hold more bottleneck interactions than co-complex interactions while both binary-Y2H and co-complex interactions are strongly enriched among co-regulated proteins and transcription factors. We discuss if such similarities are a consequence of the underlying methodology or rather reflect truly different biological patterns.
Conflict of interest statement
The authors declare no competing financial interests.
Figures
Similar articles
-
Essentiality and centrality in protein interaction networks revisited.BMC Bioinformatics. 2015 Apr 1;16:109. doi: 10.1186/s12859-015-0536-x. BMC Bioinformatics. 2015. PMID: 25880655 Free PMC article.
-
Overrepresentation of interactions between homologous proteins in interactomes.FEBS Lett. 2007 Jan 9;581(1):52-6. doi: 10.1016/j.febslet.2006.11.076. Epub 2006 Dec 8. FEBS Lett. 2007. PMID: 17174313
-
High-quality binary protein interaction map of the yeast interactome network.Science. 2008 Oct 3;322(5898):104-10. doi: 10.1126/science.1158684. Epub 2008 Aug 21. Science. 2008. PMID: 18719252 Free PMC article.
-
[Redox-sensors of microorganisms].Ukr Biokhim Zh (1999). 2008 Jul-Aug;80(4):25-34. Ukr Biokhim Zh (1999). 2008. PMID: 19140447 Review. Ukrainian.
-
[Base excision repair: AP endonucleases and DNA polymerases].Genetika. 2005 Oct;41(10):1301-9. Genetika. 2005. PMID: 16316001 Review. Russian.
Cited by
-
The interactome of Streptococcus pneumoniae and its bacteriophages show highly specific patterns of interactions among bacteria and their phages.Sci Rep. 2016 Apr 22;6:24597. doi: 10.1038/srep24597. Sci Rep. 2016. PMID: 27103053 Free PMC article.
-
A coevolution analysis for identifying protein-protein interactions by Fourier transform.PLoS One. 2017 Apr 21;12(4):e0174862. doi: 10.1371/journal.pone.0174862. eCollection 2017. PLoS One. 2017. PMID: 28430779 Free PMC article.
-
Non-interacting proteins may resemble interacting proteins: prevalence and implications.Sci Rep. 2017 Jan 13;7:40419. doi: 10.1038/srep40419. Sci Rep. 2017. PMID: 28084410 Free PMC article.
-
Centrality in the host-pathogen interactome is associated with pathogen fitness during infection.Nat Commun. 2017 Jan 16;8:14092. doi: 10.1038/ncomms14092. Nat Commun. 2017. PMID: 28090086 Free PMC article.
-
Bacterial Protein Interaction Networks: Connectivity is Ruled by Gene Conservation, Essentiality and Function.Curr Genomics. 2021 Feb;22(2):111-121. doi: 10.2174/1389202922666210219110831. Curr Genomics. 2021. PMID: 34220298 Free PMC article.
References
-
- Butland G. et al. Interaction network containing conserved and essential protein complexes in Escherichia coli. Nature 433, 531–537 (2005). - PubMed
-
- Stelzl U. et al. A human protein-protein interaction network: a resource for annotating the proteome. Cell 122, 957–968 (2005). - PubMed
-
- Rual J. F. et al. Towards a proteome-scale map of the human protein-protein interaction network. Nature 437, 1173–1178 (2005). - PubMed
Publication types
MeSH terms
Substances
LinkOut - more resources
Full Text Sources
Other Literature Sources
Molecular Biology Databases
