

Time-varying correlations between delta EEG power and heart rate variability in midlife women: the SWAN Sleep Study
- PMID: 25431173
- PMCID: PMC4376638
- DOI: 10.1111/psyp.12383
Time-varying correlations between delta EEG power and heart rate variability in midlife women: the SWAN Sleep Study
Abstract
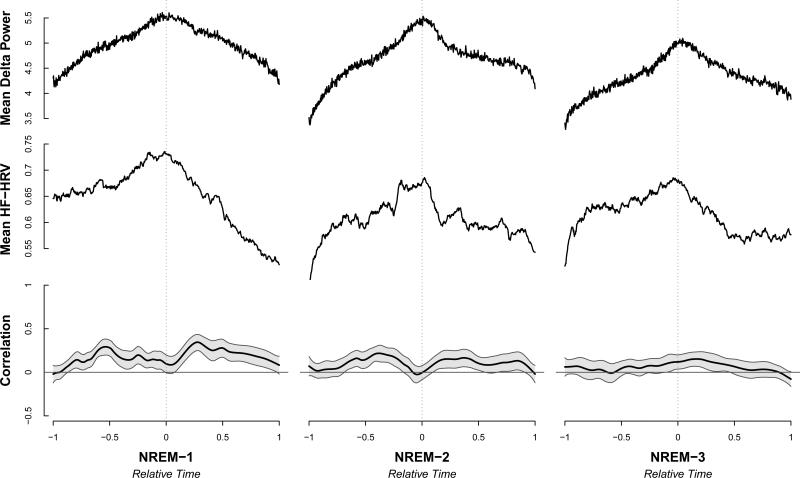
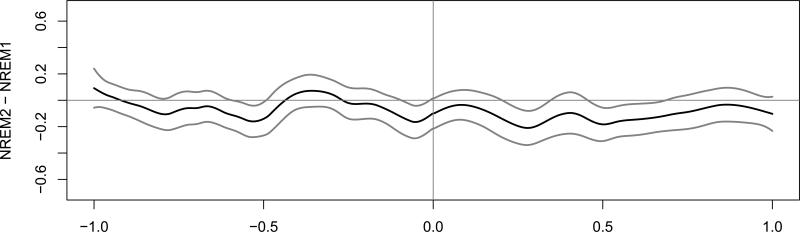
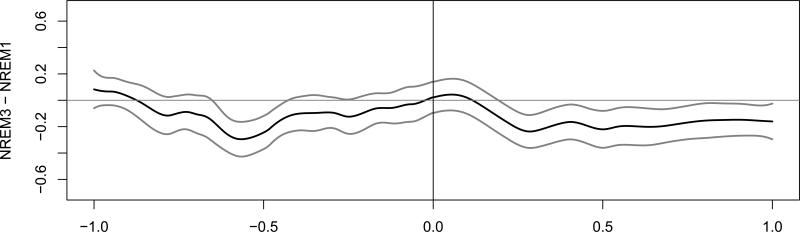
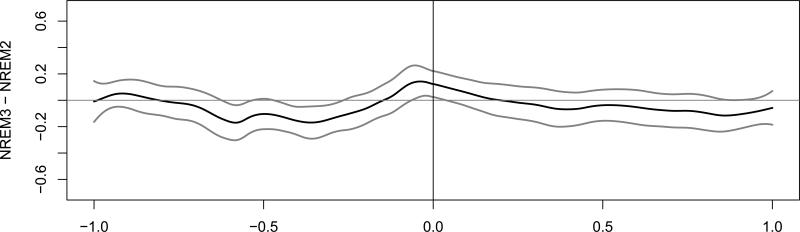
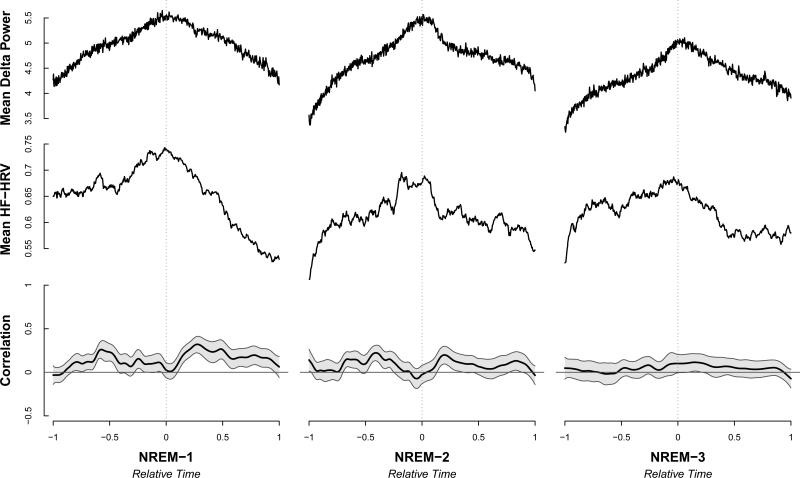
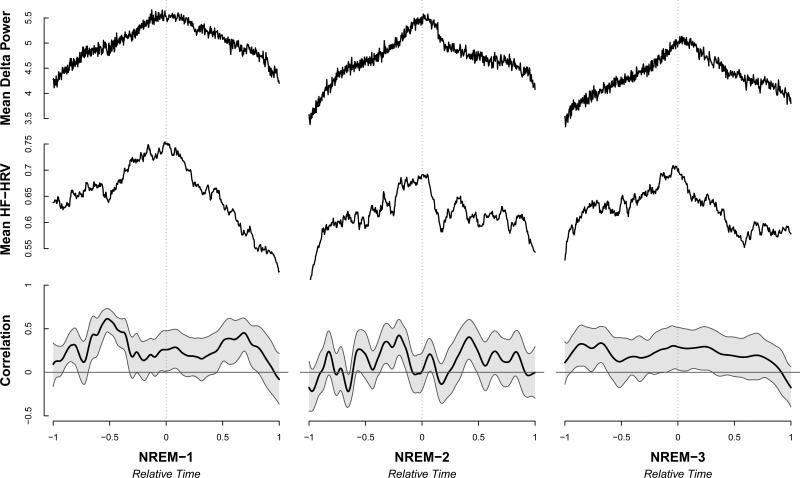
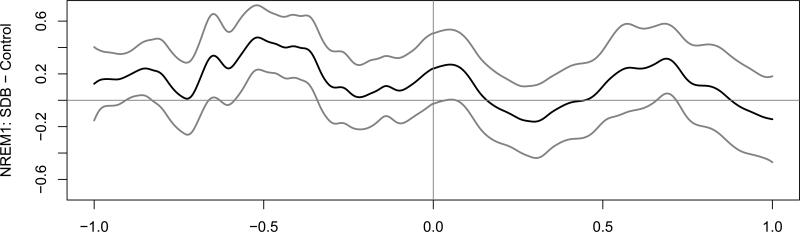
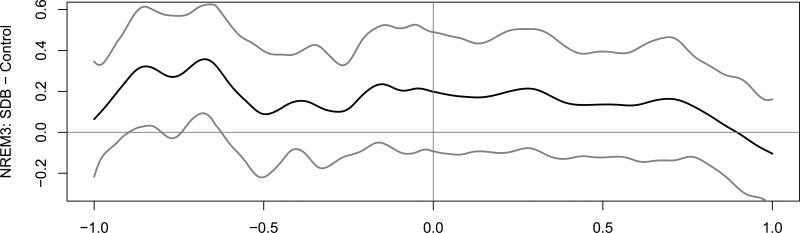
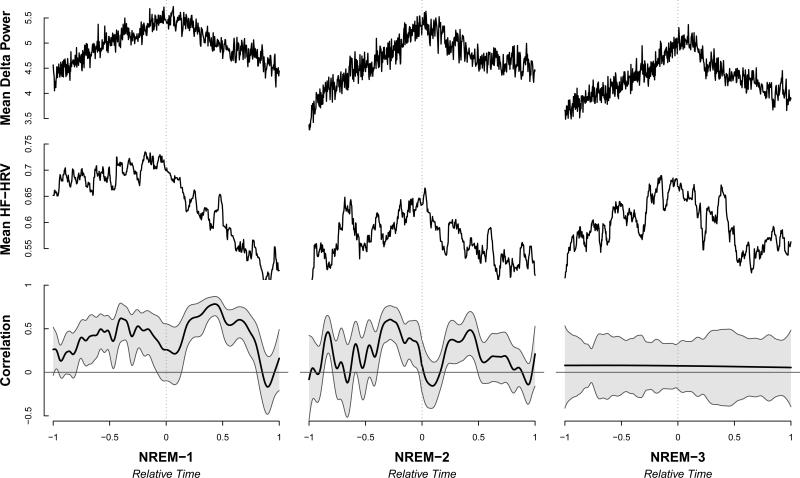
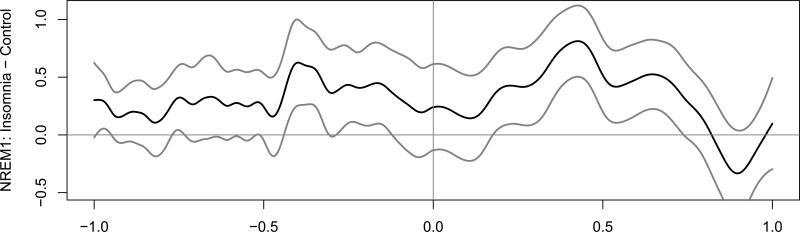
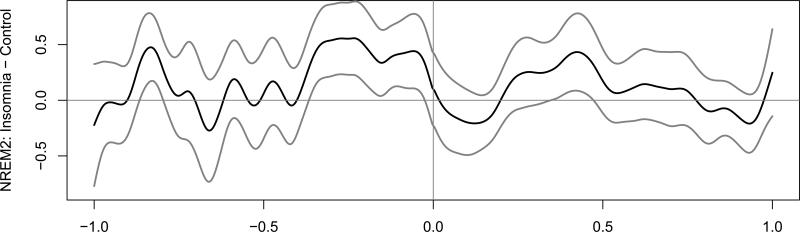
No studies have evaluated the dynamic, time-varying relationship between delta electroencephalographic (EEG) sleep and high frequency heart rate variability (HF-HRV) in women. Delta EEG and HF-HRV were measured during sleep in 197 midlife women (M(age) = 52.1, SD = 2.2). Delta EEG-HF-HRV correlations in nonrapid eye movement (NREM) sleep were modeled as whole-night averages and as continuous functions of time. The whole-night delta EEG-HF-HRV correlation was positive. The strongest correlations were observed during the first NREM sleep period preceding and following peak delta power. Time-varying correlations between delta EEG-HF-HRV were stronger in participants with sleep-disordered breathing and self-reported insomnia compared to healthy controls. The dynamic interplay between sleep and autonomic activity can be modeled across the night to examine within- and between-participant differences including individuals with and without sleep disorders.
Keywords: Delta EEG; HF-HRV; Sleep; Time-varying correlation.
Copyright © 2014 Society for Psychophysiological Research.
Figures
Similar articles
-
Relationship Between High Frequency Component of Heart Rate Variability and Delta EEG Power During Sleep in Women With Irritable Bowel Syndrome Compared to Healthy Women.Biol Res Nurs. 2025 Jan;27(1):60-70. doi: 10.1177/10998004241288791. Epub 2024 Oct 8. Biol Res Nurs. 2025. PMID: 39378890
-
EEG beta power and heart rate variability describe the association between cortical and autonomic arousals across sleep.Auton Neurosci. 2016 Jan;194:32-7. doi: 10.1016/j.autneu.2015.12.001. Epub 2015 Dec 3. Auton Neurosci. 2016. PMID: 26681575
-
The impact of chronic primary insomnia on the heart rate--EEG variability link.Clin Neurophysiol. 2009 Jun;120(6):1054-60. doi: 10.1016/j.clinph.2009.03.019. Epub 2009 Apr 28. Clin Neurophysiol. 2009. PMID: 19403330
-
Heart rate variability, sleep and sleep disorders.Sleep Med Rev. 2012 Feb;16(1):47-66. doi: 10.1016/j.smrv.2011.02.005. Epub 2011 Jun 11. Sleep Med Rev. 2012. PMID: 21658979 Review.
-
Sleep as a biological problem: an overview of frontiers in sleep research.J Physiol Sci. 2016 Jan;66(1):1-13. doi: 10.1007/s12576-015-0414-3. Epub 2015 Nov 5. J Physiol Sci. 2016. PMID: 26541158 Free PMC article. Review.
Cited by
-
Measures of cardiovascular autonomic activity in insomnia disorder: A systematic review.PLoS One. 2017 Oct 23;12(10):e0186716. doi: 10.1371/journal.pone.0186716. eCollection 2017. PLoS One. 2017. PMID: 29059210 Free PMC article.
-
Evoked K-complexes and altered interaction between the central and autonomic nervous systems during sleep in alcohol use disorder.Alcohol. 2020 May;84:1-7. doi: 10.1016/j.alcohol.2019.09.005. Epub 2019 Sep 17. Alcohol. 2020. PMID: 31539623 Free PMC article.
-
Competitive dynamics underlie cognitive improvements during sleep.Proc Natl Acad Sci U S A. 2021 Dec 21;118(51):e2109339118. doi: 10.1073/pnas.2109339118. Proc Natl Acad Sci U S A. 2021. PMID: 34903651 Free PMC article.
-
Coupling of autonomic and central events during sleep benefits declarative memory consolidation.Neurobiol Learn Mem. 2019 Jan;157:139-150. doi: 10.1016/j.nlm.2018.12.008. Epub 2018 Dec 16. Neurobiol Learn Mem. 2019. PMID: 30562589 Free PMC article.
-
Alteration of coupling between brain and heart induced by sedation with propofol and midazolam.PLoS One. 2019 Jul 17;14(7):e0219238. doi: 10.1371/journal.pone.0219238. eCollection 2019. PLoS One. 2019. PMID: 31314775 Free PMC article.
References
-
- Achermann P, Dijk DJ, Brunner DP, Borbely AA. A model of human sleep homeostasis based on EEG slow-wave activity: quantitative comparison of data and simulations. Brain Research Bulletin. 1993;31:97–113. doi:10.1016/0361-9230(93)90016-5. - PubMed
-
- American Psychiatric A. Diagnostic and Statistical Manual of Mental Disorders (DSM-IV-TR) American Psychiatric Association; Washington, DC: 2000.
-
- Bonnet MH, Arand DL. Heart rate variability: sleep stage, time of night, and arousal influences. Electroencephalography and Clinical Neurophysiology. 1997;102:390–396. doi: 10.1016/S0921-884X(96)96070-1. - PubMed
-
- Bonnet MH, Arand DL. Heart rate variability in insomniacs and matched normal sleepers. Psychosomatic Medicine. 1998;60:610–615. doi: 10.1097/00006842-199809000-00017. - PubMed
Publication types
MeSH terms
Grants and funding
- R01 GM113243/GM/NIGMS NIH HHS/United States
- UL1 TR000005/TR/NCATS NIH HHS/United States
- U01AG012535/AG/NIA NIH HHS/United States
- UL1 RR024153/RR/NCRR NIH HHS/United States
- R01AG019363/AG/NIA NIH HHS/United States
- U01 AG012554/AG/NIA NIH HHS/United States
- R01 AG019361/AG/NIA NIH HHS/United States
- U01AG012546/AG/NIA NIH HHS/United States
- R01 HL104607/HL/NHLBI NIH HHS/United States
- R01 AG019362/AG/NIA NIH HHS/United States
- UL1TR000005/TR/NCATS NIH HHS/United States
- U01AG012531/AG/NIA NIH HHS/United States
- T32 HL082610/HL/NHLBI NIH HHS/United States
- U01AG012539/AG/NIA NIH HHS/United States
- T32HL082610/HL/NHLBI NIH HHS/United States
- R01HL104607/HL/NHLBI NIH HHS/United States
- U01 AG012495/AG/NIA NIH HHS/United States
- U01 AG012505/AG/NIA NIH HHS/United States
- R01AG019361/AG/NIA NIH HHS/United States
- R01AG019362/AG/NIA NIH HHS/United States
- U01NR004061/NR/NINR NIH HHS/United States
- U01AG012553/AG/NIA NIH HHS/United States
- R01 AG019360/AG/NIA NIH HHS/United States
- T32 HL007560/HL/NHLBI NIH HHS/United States
- U01AG012495/AG/NIA NIH HHS/United States
- R01AG019360/AG/NIA NIH HHS/United States
- U01AG012505/AG/NIA NIH HHS/United States
- U01 AG012535/AG/NIA NIH HHS/United States
- R01GM113243/GM/NIGMS NIH HHS/United States
- U01 AG012553/AG/NIA NIH HHS/United States
- U01 NR004061/NR/NINR NIH HHS/United States
- U01 AG012539/AG/NIA NIH HHS/United States
- U01AG012554/AG/NIA NIH HHS/United States
- U01 AG012546/AG/NIA NIH HHS/United States
- T32HL07560/HL/NHLBI NIH HHS/United States
- U01 AG012531/AG/NIA NIH HHS/United States
- R01 AG019363/AG/NIA NIH HHS/United States
LinkOut - more resources
Full Text Sources
Other Literature Sources
Research Materials
Miscellaneous
