. 2015 Jan 2;347(6217):1258524.
doi: 10.1126/science.1258524. Epub 2014 Nov 27.

Mosquito genomics. Extensive introgression in a malaria vector species complex revealed by phylogenomics

Affiliations

Mosquito genomics. Extensive introgression in a malaria vector species complex revealed by phylogenomics

Michael C Fontaine et al. Science. .

Abstract

Introgressive hybridization is now recognized as a widespread phenomenon, but its role in evolution remains contested. Here, we use newly available reference genome assemblies to investigate phylogenetic relationships and introgression in a medically important group of Afrotropical mosquito sibling species. We have identified the correct species branching order to resolve a contentious phylogeny and show that lineages leading to the principal vectors of human malaria were among the first to split. Pervasive autosomal introgression between these malaria vectors means that only a small fraction of the genome, mainly on the X chromosome, has not crossed species boundaries. Our results suggest that traits enhancing vectorial capacity may be gained through interspecific gene flow, including between nonsister species.


Figures

Fig. 1
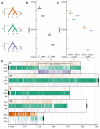
Fig. 1. Distribution and phylogenetic relationships of sequenced members of the An. gambiae complex
(A) Schematic geographic distribution of An. gambiae (gam, formerly An. gambiae S form), An. coluzzii [col, formerly An. gambiae M form ()], An. arabiensis (ara), An. quadriannulatus (qua), An. merus (mer), and An. melas (mel). (B) Species topology as estimated from a maximum likelihood (ML) phylogeny of the X chromosome (see text) compared with the ML phylogeny estimated from the whole-genome sequence alignment. The scale-bar denotes nucleotide divergence as calculated by RAxML. Red branches of the latter tree highlight topological differences with the species tree. (C) Schematic of the species topology rooted by An. christyi (An. chr) and An. epiroticus (An. epi) showing the major introgression events (green arrows) and the approximate divergence and introgression times (in million years before present, Myr, ± 1 standard deviation, SD), assuming a substitution rate of 1.1 × 10⁻⁹ per-site per-generation and 10 generations per year. The grey bar surrounding each node shows ± 2 SD. Nodes marked by asterisks are not fully resolved owing to high levels of incomplete lineage sorting. (D) Neighbor-Joining tree displaying the Euclidian distance between individuals from population samples of each species, calculated using sequence data from the X chromosome. Each species is represented by a distinct symbol shape or color.
Fig. 2
Fig. 2. Phylogenies inferred from regions on the autosomes differ strongly from phylogenies inferred from regions on the X chromosome
Maximum likelihood rooted phylogenies were inferred from n=4063 50 kb genomic windows for An. arabiensis (A), An. coluzzii (C), An. gambiae (G), An. melas (L), An. merus (R), and An. quadriannulatus (Q), with An. christyi as outgroup. The nine most commonly observed topologies across the genome (trees i-ix) are indicated on each of the five chromosome arms (if found) by correspondingly colored blocks whose length represents the proportion of all 50 kb windows on that arm which support that topology. Topologies specific to 2La are represented by the dark grey block on 2L, and all other topologies observed on each chromosome arm were pooled and their combined frequencies are indicated by the light grey blocks. The X chromosome most often indicates that A and Q are sister taxa (trees vii–ix), while the autosomes indicate that A and C+G are sister groups (trees i–vi). Large portions of the autosomes (particularly 3L and 3R) indicate R and Q are sister taxa (trees iv–vi). Additional diversity in inferred trees is the result of rearrangement of three groups (R, C+G, and L+A+Q) due to incomplete lineage sorting. The most common phylogeny on the X chromosome (vii) represents the most likely species branching order. The 2L arm has a markedly different distribution of phylogenies due to the unique history of the 2La inversion region (see Fig. 5), which creates unusual phylogenetic topologies found nowhere else in the genome. The autosome-like trees on the X chromosome (i and ii) are entirely found in the pericentromeric region (15-24 Mb; see Fig. 3D), where introgression between An. arabiensis and An. gambiae + An. coluzzi has previously been implicated.
Fig. 3
Fig. 3. Tree height reveals the true species branching order in the face of introgression
(A) Color-coded trees show the three possible rooted phylogenetic relationships for An. arabiensis (A), An. gambiae s.s. (G), and An. melas (L), with outgroup An. christyi. For any group of three taxa, there are two species divergence times (T1 and T2). When introgression has occurred, a strong decrease is expected in these divergence times. (B), Trees on the X chromosome have significantly higher mean values of T1 and T2 than the autosomes, indicating introgression is more likely to have occurred on the autosomes than the X chromosome (diamond = mean, whiskers ± S.E. offset to the right for visual clarity; both P<1.0×10−40). (C) Even among only autosomal loci, regions with the X majority relationship G(LA) (orange) have significantly higher T1 and T2 (both P<1.0×10−40), indicating that the autosomal majority topology (green) is the result of widespread introgression between An. arabiensis and An. gambiae. The X majority relationship G(LA) therefore represents the true species branching relationships. (D) The gene tree distributions or “chromoplots” for all five chromosomal arms show that the autosomal and X chromosome phylogenies strongly disagree. Three-taxon phylogenies were inferred from 10 kb chromosomal windows across the genome, and colored vertical bars represent the relative abundance of the three alternative topologies (panel A) in a 200 kb window. The proportions of the three 10 kb gene trees for each chromosome arm (left) indicate that the autosomes all strongly show a closer relationship between An. gambiae and An. arabiensis (green), while the X indicates a closer relationship between An. arabiensis and An. melas (orange). Black semi-circles indicate the location of centromeres.
Fig. 4
Fig. 4. Introgression between An. merus and An. quadriannulatus
Chromoplots for all five chromosomal arms show a highly spatially heterogeneous distribution of phylogenies inferred from 50 kb genomic regions, particularly on 3L. The three possible rooted phylogenetic relationships for An. quadriannulatus (Q), An. melas (L), and An. merus (R), with outgroup An. christyi are shown, colored according to the key in the lower-right. The region on 3L corresponding to the 3La inversion shows strong evidence of R-Q introgression, and a strong negative deviation of the D-statistic. The region on 2L corresponding to the 2La inversion is highly enriched for the R(LQ) relationship, as expected given that L and Q both have the 2L+a orientation, while R has 2La (see Fig. 5). Across all the autosomes, the D-statistic generally trends toward negative values, indicating weak or ancient R-Q introgression may have been occurring across the autosomes (see SOM Text 3).
Fig. 5
Fig. 5. Ancient trans-specific polymorphism of an inversion predates radiation of the An. gambiae complex
(A) All species in the complex are fixed for either the 2La (An. arabiensis, ara; An. merus, mer) or 2L+a (An. melas, mel) orientation of the 2La rearrangement except An. gambiae (gam) and An. coluzzii (col), which remain polymorphic for both orientations. The unique phylogenies observed in the 2La region (Fig. 2) are the result of differential loss (×) of the 2La and 2L+a orientations and the introgression of 2La from the ancestral population of An. gambiae + coluzzii into An. arabiensis (dotted arrow). The overall divergence between the 2La and 2L+a orientations inferred from sequences inside the inversion breakpoints is higher on average than the predicted divergence time of the species complex. (B) Maximum likelihood phylogeny inferred from sequences of the two different orientations of the 2La region (2La and 2L+a) shows that the divergence between opposite orientations is greater than the divergence between the same orientation present in different species (all nodes, 100% bootstrap support). Particularly notable is the separation of the sister taxa An. gambiae-2L+a and An. coluzzii-2La, as these are known sister taxa. The scale-bar denotes nucleotide divergence as calculated by RAxML.

Comment in

References

    1. Green RE, Krause J, Briggs AW, Maricic T, Stenzel U, Kircher M, Patterson N, Li H, Zhai W, Fritz MH, Hansen NF, Durand EY, Malaspinas AS, Jensen JD, Marques-Bonet T, Alkan C, Prufer K, Meyer M, Burbano HA, Good JM, Schultz R, Aximu-Petri A, Butthof A, Hober B, Hoffner B, Siegemund M, Weihmann A, Nusbaum C, Lander ES, Russ C, Novod N, Affourtit J, Egholm M, Verna C, Rudan P, Brajkovic D, Kucan Z, Gusic I, Doronichev VB, Golovanova LV, Lalueza-Fox C, de la Rasilla M, Fortea J, Rosas A, Schmitz RW, Johnson PL, Eichler EE, Falush D, Birney E, Mullikin JC, Slatkin M, Nielsen R, Kelso J, Lachmann M, Reich D, Paabo S. A draft sequence of the Neandertal genome. Science. 2010;328:710–722. - PMC - PubMed
    1. Dasmahapatra KK, Walters JR, Briscoe AD, Davey JW, Whibley A, Nadeau NJ, Zimin AV, Hughes DS, Ferguson LC, Martin SH, Salazar C, Lewis JJ, Adler S, Ahn SJ, Baker DA, Baxter SW, Chamberlain NL, Chauhan R, Counterman BA, Dalmay T, Gilbert LE, Gordon K, Heckel DG, Hines HM, Hoff KJ, Holland PW, Jacquin-Joly E, Jiggins FM, Jones RT, Kapan DD, Kersey P, Lamas G, Lawson D, Mapleson D, Maroja LS, Martin A, Moxon S, Palmer WJ, Papa R, Papanicolaou A, Pauchet Y, Ray DA, Rosser N, Salzberg SL, Supple MA, Surridge A, Tenger-Trolander A, Vogel H, Wilkinson PA, Wilson D, Yorke JA, Yuan F, Balmuth AL, Eland C, Gharbi K, Thomson M, Gibbs RA, Han Y, Jayaseelan JC, Kovar C, Mathew T, Muzny DM, Ongeri F, Pu LL, Qu J, Thornton RL, Worley KC, Wu YQ, Linares M, Blaxter ML, ffrench-Constant RH, Joron M, Kronforst MR, Mullen SP, Reed RD, Scherer SE, Richards S, Mallet J, McMillan W, Jiggins CD. Butterfly genome reveals promiscuous exchange of mimicry adaptations among species. Nature. 2012;487:94–98. - PMC - PubMed
    1. Martin SH, Dasmahapatra KK, Nadeau NJ, Salazar C, Walters JR, Simpson F, Blaxter M, Manica A, Mallet J, Jiggins CD. Genome-wide evidence for speciation with gene flow in Heliconius butterflies. Genome Res. 2013;23:1817–1828. - PMC - PubMed
    1. Durand EY, Patterson N, Reich D, Slatkin M. Testing for ancient admixture between closely related populations. Mol. Biol. Evol. 2011;28:2239–2252. - PMC - PubMed
    1. Garrigan D, Kingan SB, Geneva AJ, Andolfatto P, Clark AG, Thornton KR, Presgraves DC. Genome sequencing reveals complex speciation in the Drosophila simulans clade. Genome Res. 2012;22:1499–1511. - PMC - PubMed

Publication types