. 2014 Nov 13:5:507.
doi: 10.3389/fimmu.2014.00507. eCollection 2014.

Increasing Obesity in Treated Female HIV Patients from Sub-Saharan Africa: Potential Causes and Possible Targets for Intervention

Affiliations

Increasing Obesity in Treated Female HIV Patients from Sub-Saharan Africa: Potential Causes and Possible Targets for Intervention

Claire L McCormick et al. Front Immunol. .

Abstract

Objectives: To investigate changing nutritional demographics of treated HIV-1-infected patients and explore causes of obesity, particularly in women of African origin.

Methods: We prospectively reviewed nutritional demographics of clinic attenders at an urban European HIV clinic during four one-month periods at three-yearly intervals (2001, 2004, 2007, and 2010) and in two consecutive whole-year reviews (2010-2011 and 2011-2012). Risk-factors for obesity were assessed by multiple linear regression. A sub-study of 50 HIV-positive African female patients investigated body-size/shape perception using numerical, verbal, and pictorial cues.

Results: We found a dramatic rise in the prevalence of obesity (BMI > 30 kg/m(2)), from 8.5 (2001) to 28% (2011-2012) for all clinic attenders, of whom 86% were on antiretroviral treatment. Women of African origin were most affected, 49% being obese, with a further 32% overweight (BMI 25-30 kg/m(2)) in 2012. Clinical factors strongly associated with obesity included female gender, black African ethnicity, non-smoking, age, and CD4 count (all P < 0.001); greater duration of cART did not predict obesity. Individual weight-time trends mostly showed slow long-term progressive weight gain. Investigating body-weight perception, we found that weight and adiposity were underestimated by obese subjects, who showed a greater disparity between perceived and actual adiposity (P < 0.001). Obese subjects targeted more obese target "ideal" body shapes (P < 0.01), but were less satisfied with their body shape overall (P = 0.02).

Conclusion: Seropositive African women on antiretroviral treatment are at heightened risk of obesity. Although multifactorial, body-weight perception represents a potential target for intervention.

Keywords: HIV; HIV-associated lipodystrophy syndrome; antiretroviral treatment; body mass index; body weight; ethnology; obesity.


Figures
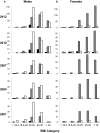
Figure 1
Figure 1
Changing nutritional status of HIV-clinic attenders according to ethnicity and gender. Values represent number of participants by gender [males (A) and females (B)], ethnicity (filled columns, Asian; shaded columns, black African; open columns, white Caucasian), and by BMI category: wasted (<18.5), undernourished (18.5–20), normal (–25), overweight (–30), and obese (>30 kg/m2). Data from 2001 to 2010 represent one-month prospective reviews, 2001 (n = 164; 96:68 male:female), 2004 (n = 204; 114:90), 2007 (n = 196; 109:87), and 2010 (n = 373; 213:160). Data from 2012 represent attenders over a whole year (n = 1031); similar data were obtained in 2011 (not shown). The small number of subjects in other ethnic groups is not shown for clarity.
Figure 2
Figure 2
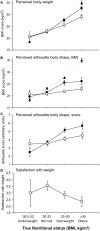
Relationship of perceived and ideal body size to current nutritional status. (A) Perceived body weight: True (filled triangles, dashed line), usual (filled circles), and ideal (open squares) body weight, expressed in kilograms (normalized to BMI) of patients according to current nutritional status category. “True” represents measured values, and “Usual” and “Ideal” were derived from questionnaire responses. (B) Perceived body shape from silhouettes corresponding to known BMI values (Series A) compared to true BMI (filled triangles). Data are shown for perceived “current” shape (filled circles) and “ideal” shape (open squares). (C) Perceived body shape from numbered silhouettes (Series B) expressed as “current” shape (filled circles) and “ideal” shape (open squares). (D) Subjects’ happiness with current body-weight scored from 1 to 5 (1, very unhappy; 2, unhappy; 3, not bothered; 4, happy; 5, very happy) according to current BMI category. All data shown are means ± 1 SEM.
Figure 3
Figure 3
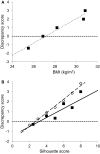
Discrepancy between current and ideal body shape from body shape silhouettes. (A) Discrepancy (current minus ideal) silhouette score groups, shown according to the corresponding current mean BMI for that group (groups with scores 1 and 2 were small so were conflated), showing higher discrepancy scores correspond to higher BMI’s (r = 0.37, intercept 26.9 kg/m2, P < 0.01, n = 47). (B) Filled squares: discrepancy scores by current silhouette score where higher silhouette score indicates greater adiposity (r = 0.61, P < 0.001, n = 47). Comparison is made with normative data (open diamonds) from a large Caucasian population (n = 16,728) (41).
Figure 4
Figure 4
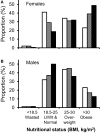
Comparison of nutritional demographics in HIV-clinic attenders to the general population. Distribution between different nutritional status groups for HIV-positive clinic attenders (solid bars) versus the general population (open and hatched bars). (A) Men, general population (open), black African men in general population (shaded), HIV-positive Caucasian males (solid bars), and (B) women, general population (open bars), black African women in general population (shaded), HIV-positive black African women (solid bars). Comparative data (HSE), expressed as percentage of each ethnic group, are from the Health Survey of England (n = 11,022; 5,443 classified by ethnic group, including 629 black Africans) (38). Note, HSE data did not give subgroup data for white Caucasian populations and were not subdivided at 20 kg/m2, so “underweight” and “normal” weight clinic attenders have been conflated to demonstrate comparable data.

References

    1. Macallan DC, Noble C, Baldwin C, Jebb SA, Prentice AM, Coward WA, et al. Energy expenditure and wasting in human immunodeficiency virus infection. N Engl J Med (1995) 333(2):83–8.10.1056/NEJM199507133330202 - DOI - PubMed
    1. Hodgson LM, Ghattas H, Pritchitt H, Schwenk A, Payne L, Macallan DC. Wasting and obesity in HIV outpatients. AIDS (2001) 15(17):2341–210.1097/00002030-200111230-00024 - DOI - PubMed
    1. Mangili A, Murman DH, Zampini AM, Wanke CA. Nutrition and HIV infection: review of weight loss and wasting in the era of highly active antiretroviral therapy from the nutrition for healthy living cohort. Clin Infect Dis (2006) 42(6):836–42.10.1086/500398 - DOI - PubMed
    1. Friis-Moller N, Sabin CA, Weber R, d’Arminio MA, El-Sadr WM, Reiss P, et al. Combination antiretroviral therapy and the risk of myocardial infarction. N Engl J Med (2003) 349(21):1993–2003.10.1056/NEJMoa030218 - DOI - PubMed
    1. Sabin CA, Worm SW, Weber R, Reiss P, El-Sadr W, Dabis F, et al. Use of nucleoside reverse transcriptase inhibitors and risk of myocardial infarction in HIV-infected patients enrolled in the D:A:D study: a multi-cohort collaboration. Lancet (2008) 371(9622):1417–26.10.1016/S0140-6736(08)60423-7 - DOI - PMC - PubMed

LinkOut - more resources