. 2012 Jun 1;3(6):1829-1834.
doi: 10.1039/C2SC20273E. Epub 2012 Apr 18.

A cell-permeable gadolinium contrast agent for magnetic resonance imaging of copper in a Menkes disease model

Affiliations

A cell-permeable gadolinium contrast agent for magnetic resonance imaging of copper in a Menkes disease model

Emily L Que et al. Chem Sci. .

Abstract

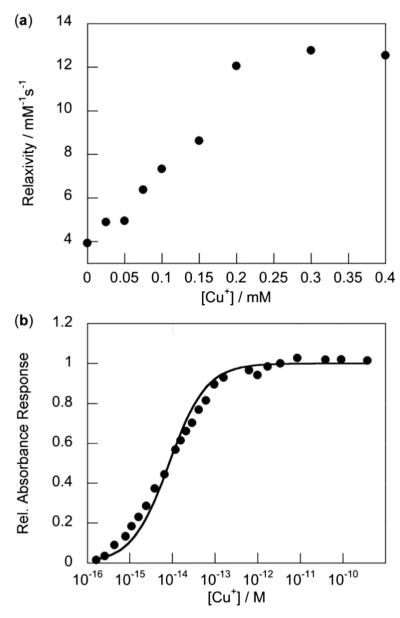
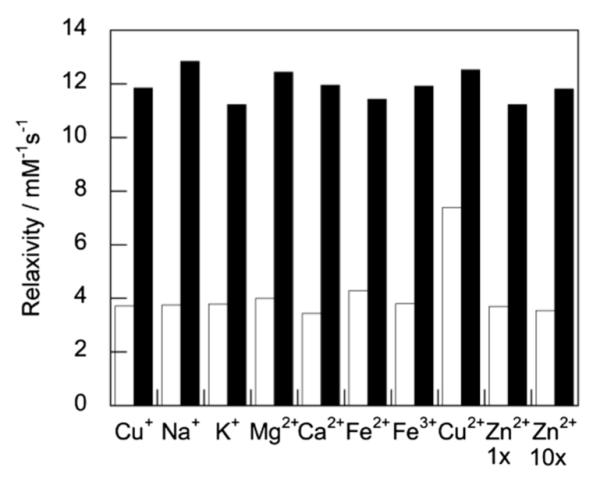
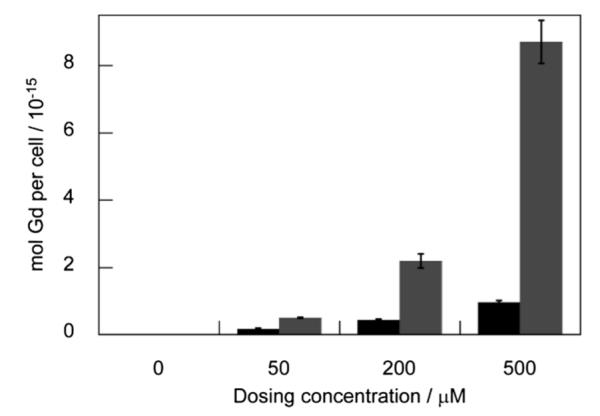
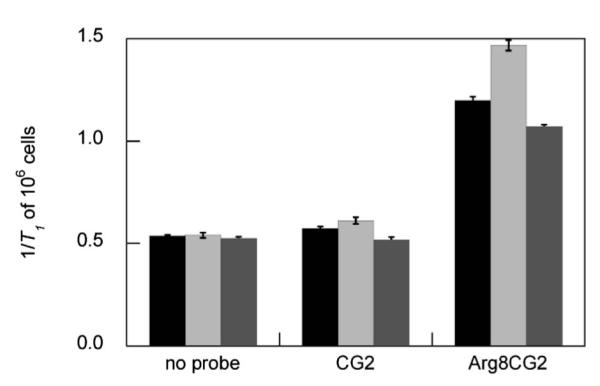
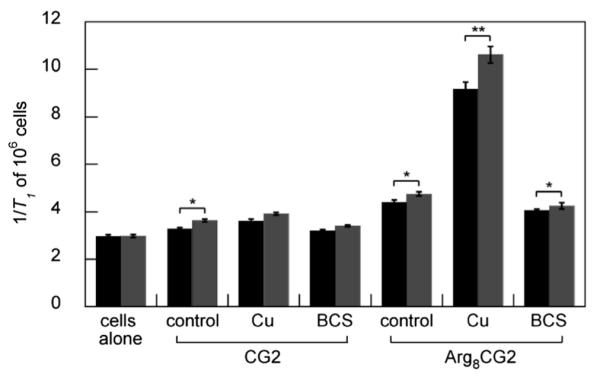
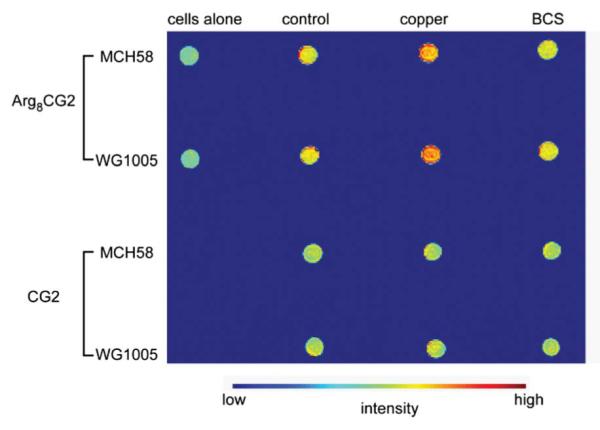
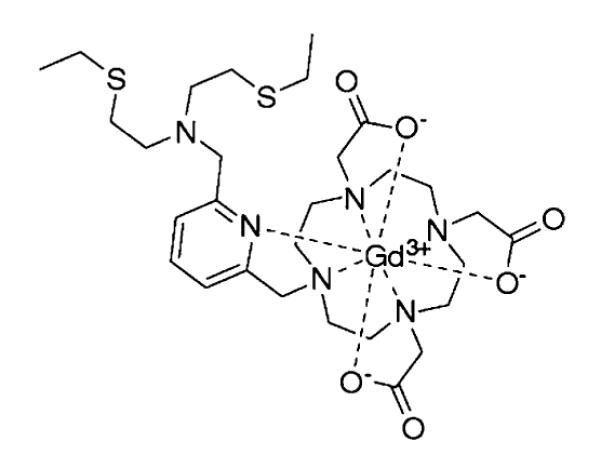
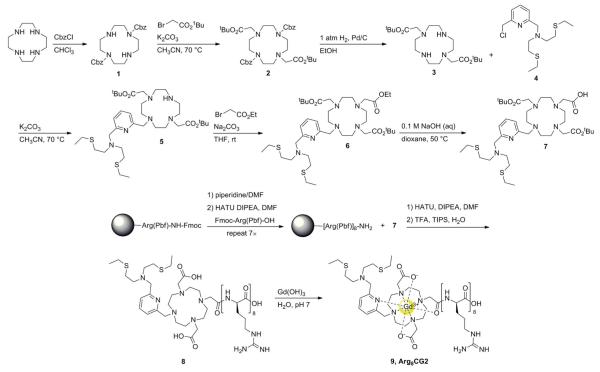
We present the synthesis and characterization of octaarginine-conjugated Copper-Gad-2 (Arg8CG2), a new copper-responsive magnetic resonance imaging (MRI) contrast agent that combines a Gd3+-DO3A scaffold with a thioether-rich receptor for copper recognition. The inclusion of a polyarginine appendage leads to a marked increase in cellular uptake compared to previously reported MRI-based copper sensors of the CG family. Arg8CG2 exhibits a 220% increase in relaxivity (r1 = 3.9 to 12.5 mM-1 s-1) upon 1 : 1 binding with Cu+, with a highly selective response to Cu+ over other biologically relevant metal ions. Moreover, Arg8CG2 accumulates in cells at nine-fold greater concentrations than the parent CG2 lacking the polyarginine functionality and is retained well in the cell after washing. In cellulo relaxivity measurements and T1-weighted phantom images using a Menkes disease model cell line demonstrate the utility of Arg8CG2 to report on biological perturbations of exchangeable copper pools.


Figures

Fig. 1
Fig. 1
Interaction of Arg8CG2 with Cu+. (a) Plot of r1 relaxivity versus added Cu+ for a 0.2 mM solution of Arg8CG2 in PBS (pH 7.4), at 37 °C at a proton Larmor frequency of 60 MHz. (b) Normalized absorbance response of 0.2 mM Arg8CG2 to buffered Cu+ solutions for determination of the apparent Kd value. Spectra were acquired in PBS (pH 7.4) at 25 °C. The black trace represents the best fit (Kd = 8.3 × 10⁻¹⁵ M, R2 = 0.986).
Fig. 2
Fig. 2
Relaxivity responses of Arg8CG2 to various metal ions. White bars represent the addition of the appropriate metal ion (10 mM for Na+; 2 mM for K+, Mg2+, and Ca2+; 0.2 mM for Fe2+, Fe3+ and Cu2+) to 0.2 mM Arg8CG2. Response to Zn2+ was measured both at 0.2 mM Zn2+ (Zn2+ 1 ×) and 2 mM Zn2+ (Zn2+ 10 ×). Black bars represent the subsequent addition of 0.2 mM Cu+ to the contrast agent solution. Relaxivity measurements were acquired at 37 °C in PBS (pH 7.4) at a proton Larmor frequency of 60 MHz.
Fig. 3
Fig. 3
Cellular uptake of complexes in HEK 293T cells. (a) CG2 (black) and Arg8CG2 (gray) in HEK 293T cells following 1 h incubation at various dosing concentrations. After incubation, cells were rinsed with PBS, lysed with RIPA buffer, dissolved in nitric acid and analyzed by ICP–MS. Error bars represent one standard deviation (n = 4).
Fig. 4
Fig. 4
1/T1 values of HEK 293T cells treated with 500 mM CG2 or Arg8CG2 following incubation with vehicle control (black), copper (light gray, 100 μM, 48 h) or BCS (dark gray, 200 μM, 48 h). Relaxivity measurements were acquired at 37 °C in PBS (pH 7.4) at a proton Larmor frequency of 60 MHz. Error bars represent one standard deviation (n = 3) and statistical analyses were performed with a two-tailed Student’s t-test relative to the control. * P < 0.05, ** P < 0.01.
Fig. 5
Fig. 5
1/T1 values of MCH58 (black) and WG1005 (gray) cells treated with 500 μM CG2 (left) or Arg8CG2 (right) following incubation with vehicle control, copper (100 μM, 48 h) or BCS (200 μM, 48 h). Relaxivity measurements were acquired at 37 °C in PBS (pH 7.4) at a proton Larmor frequency of 60 MHz. Error bars represent one standard deviation (n = 3) and statistical analysis were performed with a two-tailed Student’s t-test relative to the control. * P < 0.05, ** P < 0.01.
Fig. 6
Fig. 6
T1-weighted phantom images of MCH58 and WG1005 cells treated with CG2 or Arg8CG2 (500 μM, 1 h). Images were acquired at 25 °C at 1.5 T (~64 MHz proton Larmor frequency).
Scheme 1
Scheme 1
Copper-Gad contrast agent, CG2.
Scheme 2
Scheme 2
Synthesis of Arg8CG2.

References

    1. Que EL, Domaille DW, Chang CJ. Chem. Rev. 2008;108:1517–1549. - PubMed
    1. Liu J, Lu Y. J. Am. Chem. Soc. 2007;129:9838–9839. - PubMed
    1. Liu J, Lu Y. Chem. Commun. 2007:4872–4874. - PubMed
    1. Wegner SV, Arslan H, Sunbul M, Yin J, He C. J. Am. Chem. Soc. 2010;132:2567–2569. - PubMed
    1. Wegner SV, Sun F, Hernandez N, He C. Chem. Commun. 2011;47:2571–2573. - PubMed