. 2012;1(6):10.1186/2192-2853-1-6.
doi: 10.1186/2192-2853-1-6.

A high-density 3D localization algorithm for stochastic optical reconstruction microscopy

Affiliations

A high-density 3D localization algorithm for stochastic optical reconstruction microscopy

Hazen Babcock et al. Opt Nanoscopy. 2012.

Abstract

Background: Stochastic optical reconstruction microscopy (STORM) and related methods achieves sub-diffraction-limit image resolution through sequential activation and localization of individual fluorophores. The analysis of image data from these methods has typically been confined to the sparse activation regime where the density of activated fluorophores is sufficiently low such that there is minimal overlap between the images of adjacent emitters. Recently several methods have been reported for analyzing higher density data, allowing partial overlap between adjacent emitters. However, these methods have so far been limited to two-dimensional imaging, in which the point spread function (PSF) of each emitter is assumed to be identical.

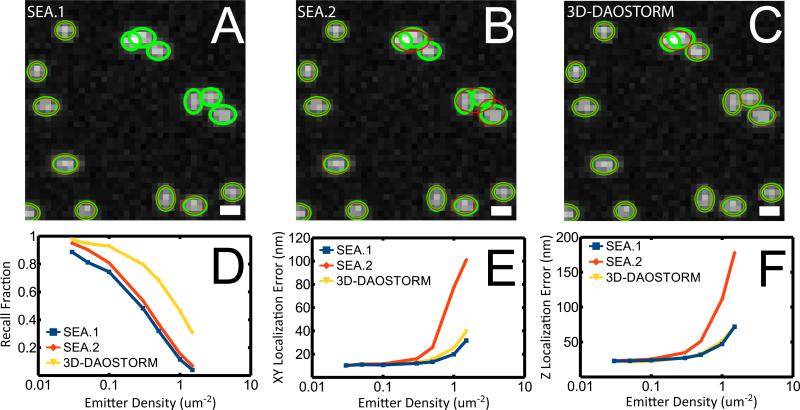
Methods: In this work, we present a method to analyze high-density super-resolution data in three dimensions, where the images of individual fluorophores not only overlap, but also have varying PSFs that depend on the z positions of the fluorophores.

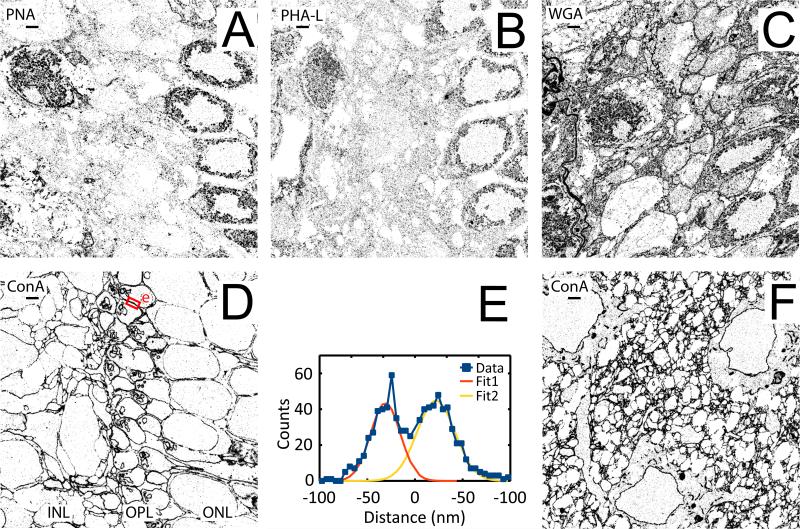
Results and conclusion: This approach can accurately analyze data sets with an emitter density five times higher than previously possible with sparse emitter analysis algorithms. We applied this algorithm to the analysis of data sets taken from membrane-labeled retina and brain tissues which contain a high-density of labels, and obtained substantially improved super-resolution image quality.


Figures

Figure 1
Figure 1
Comparison of the 3D-DAOSTORM and sparse emitter analysis (SEA) algorithms on simulated data. (A) Analysis of simulated 3D data using the sparse emitter analysis algorithm with image-shape-based filtering (SEA.1). The simulated images of emitters are shown in grey scale and their actual locations are indicated by green ovals. The localizations identified by the analysis are marked by red ovals. The widths of the ovals in x and y are drawn proportional to the simulated PSF widths of the emitters. The molecule density is 0.3 molecules / um2. (B, C) Same as A, except that the analysis was performed using the sparse emitter analysis algorithm without any image-shape-based filtering (SEA.2) (B) and the 3D-DAOSTORM algorithm (C). Scale bars: 4 pixels or 668 nm. (D) A comparison of the recall fraction for the three different analysis methods on the simulated 3D STORM data. The recall fraction is defined as the fraction of the emitters that were identified by the algorithm. (E) A comparison of the localization error in the xy plane for the three different analysis methods on the simulated 3D STORM data. (F) A comparison of the z localization error for the three analysis methods. Data in (D-F) are extracted from ten 256 × 256 pixel images as shown in A-C.
Figure 2
Figure 2
2D STORM images of mouse retina and cortex labeled with lectin – Alexa-647 conjugates. (A-D) Images are centered on the outer plexiform layer (OPL) of the retina and oriented such that the outer nuclear layer (ONL) are to the right and the inner nuclear layer (INL) is to the left. (A) PNA. (B) PHA-L lectin. (C) WGA lectin. (D) ConA lectin. (E) Cross-section profile of the region indicated by the small red rectangle with the “e” next to it in the upper part of (D). The two membranes are separated by a distance of 53 nm and have a width of ~35 nm as determined by multi-Gaussian fitting. (F) Image of a cortex region stained with ConA. All images were taken from lectin labeled tissue sections that are 50nm thick. Scale bars: 1 μm.
Figure 3
Figure 3
3D STORM image of the outer plexiform layer of mouse retina labeled with the ConA – Alexa-647 conjugate. (A) A single frame of the STORM data with localizations identified by the sparse emitter analysis algorithm (SEA.1) overlaid as red ovals. (B) Same as A except that the localization were identified using the 3D-DAOSTORM algorithm. (C) STORM image resulting from analysis with the sparse emitter analysis algorithm. The z-coordinates of the localizations are color-coded according to the colored scale bar. (D) STORM image of the same area resulting from analysis with the 3D-DAOSTORM algorithm. (E) A zoom in of the area indicated by the white box in C. (F) A zoom in of the same area in D. (G) Cross-section profile of the image areas in outlined in E and F by the red box with the letter “g” next to it. (H-I) Same as G for the areas indicated by red lines in C and D with a letter “h” (H) and “i” (I) next to them. (J-K) XZ cross-section images of the area in C and D indicated by the letter “j” (J) and “k” (K), respectively. Scale bars: 1 um in A and B, 4 um in C and D, 500 nm in E and F, 100nm in J and K.

References

    1. Anderson E, et al. LAPACK Users Guide, Society for Industrial and Applied Mathematics. 1999
    1. Bates M, Huang B, Dempsey GT, Zhuang X. Multicolor Super-Resolution Imaging with Photo-Switchable Fluorescent Probes. Science. 2007;317(5845):1749–1753. - PMC - PubMed
    1. Betzig E, et al. Imaging intracellular fluorescent proteins at nanometer resolution. Science. 2006;313(5793):1642–1645. - PubMed
    1. Cox S, et al. Bayesian localization microscopy reveal nanoscale podosome dynamics. Nature Methods. 2012;9:195–200. - PMC - PubMed
    1. Dempsey GT, Vaughan JC, Chen KH, Bates M, Zhuang X. Evaluation of fluorophores for optimal performance in localization-based super-resolution imaging. Nature Methods. 2011;8:1027–1036. - PMC - PubMed

LinkOut - more resources