. 2014 Nov 28:3:e04499.
doi: 10.7554/eLife.04499.

Disruption of thalamic functional connectivity is a neural correlate of dexmedetomidine-induced unconsciousness

Affiliations

Disruption of thalamic functional connectivity is a neural correlate of dexmedetomidine-induced unconsciousness

Oluwaseun Akeju et al. Elife. .

Abstract

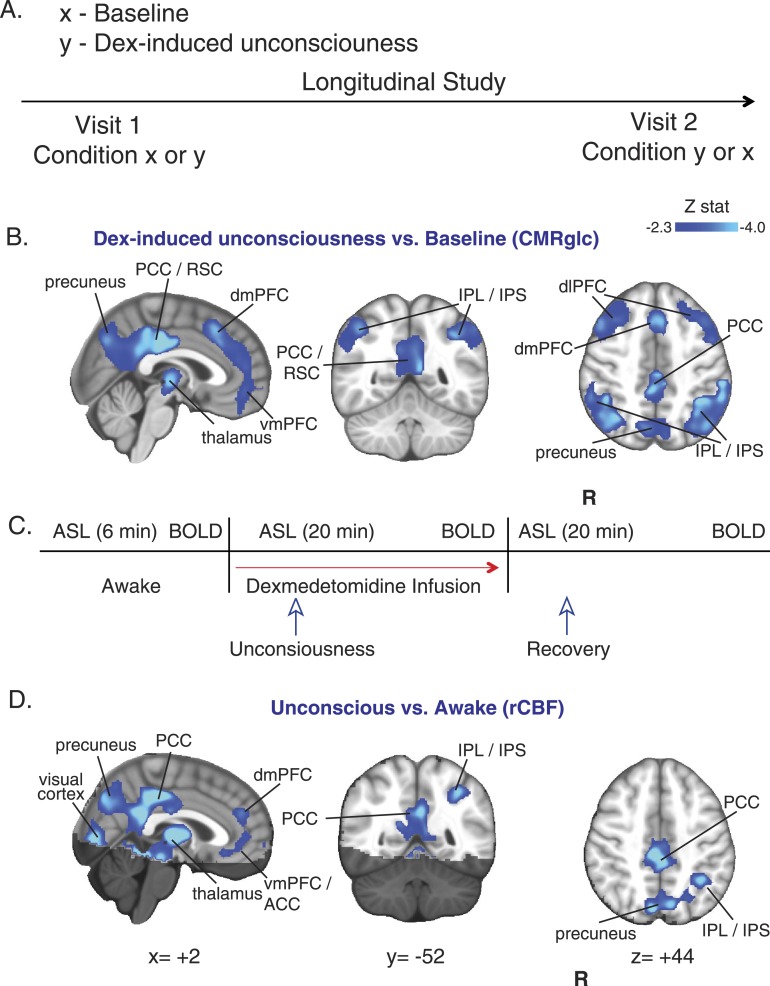
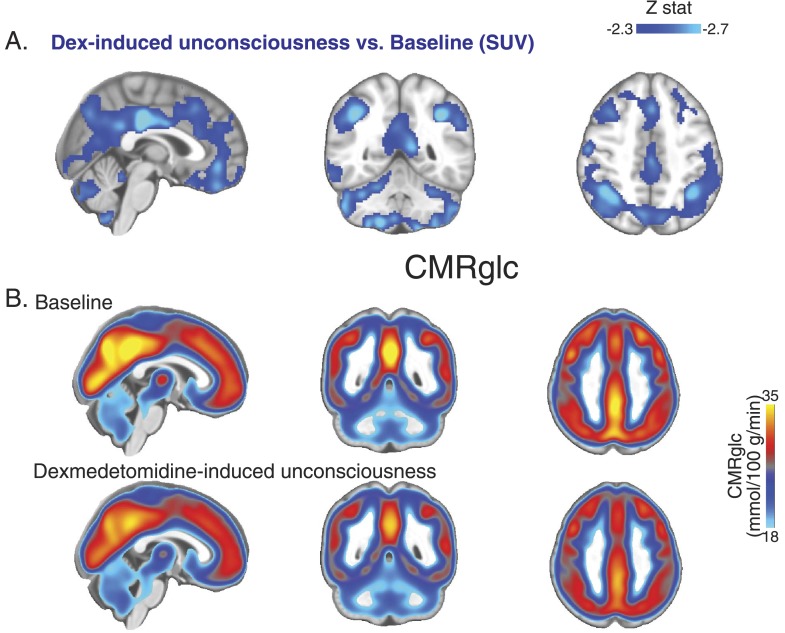
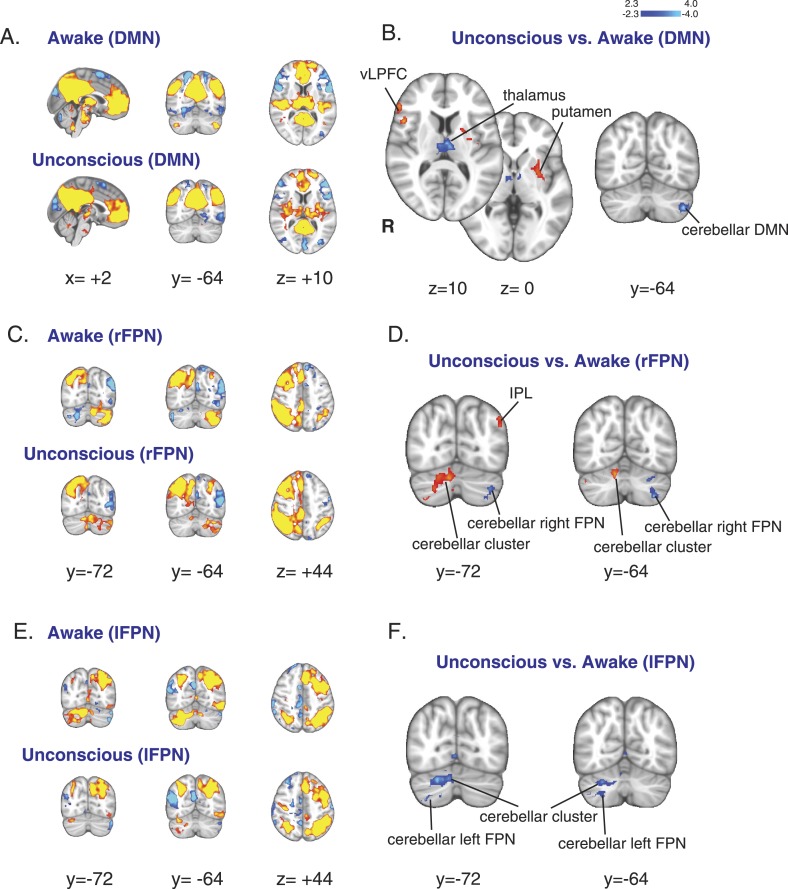
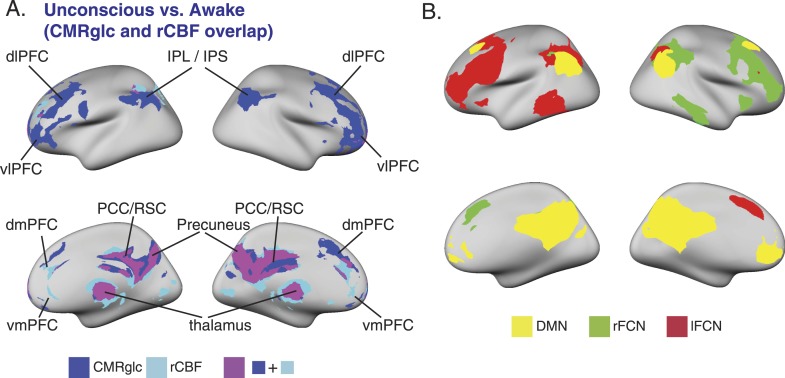
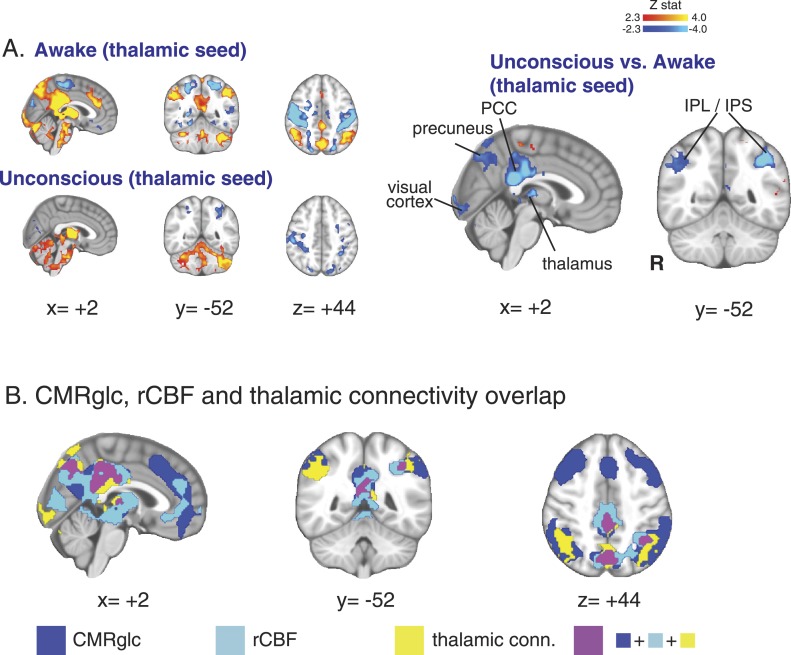
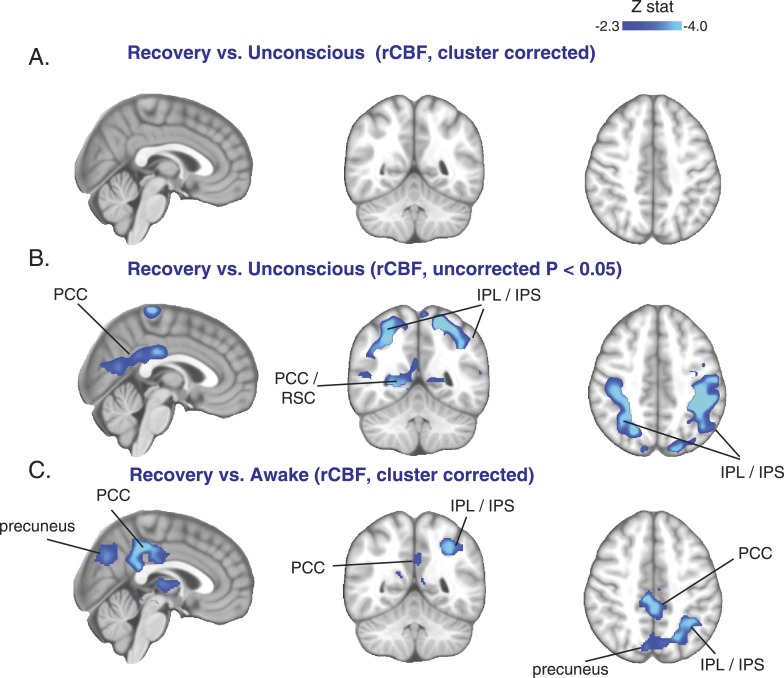
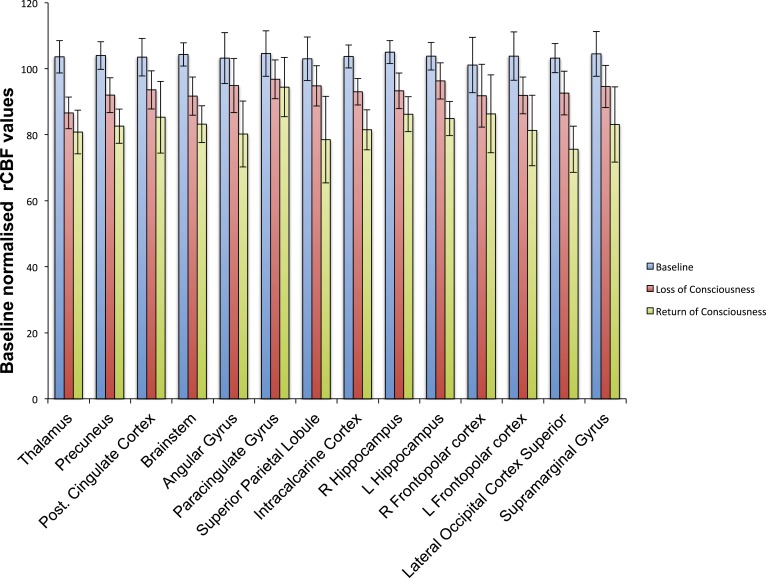
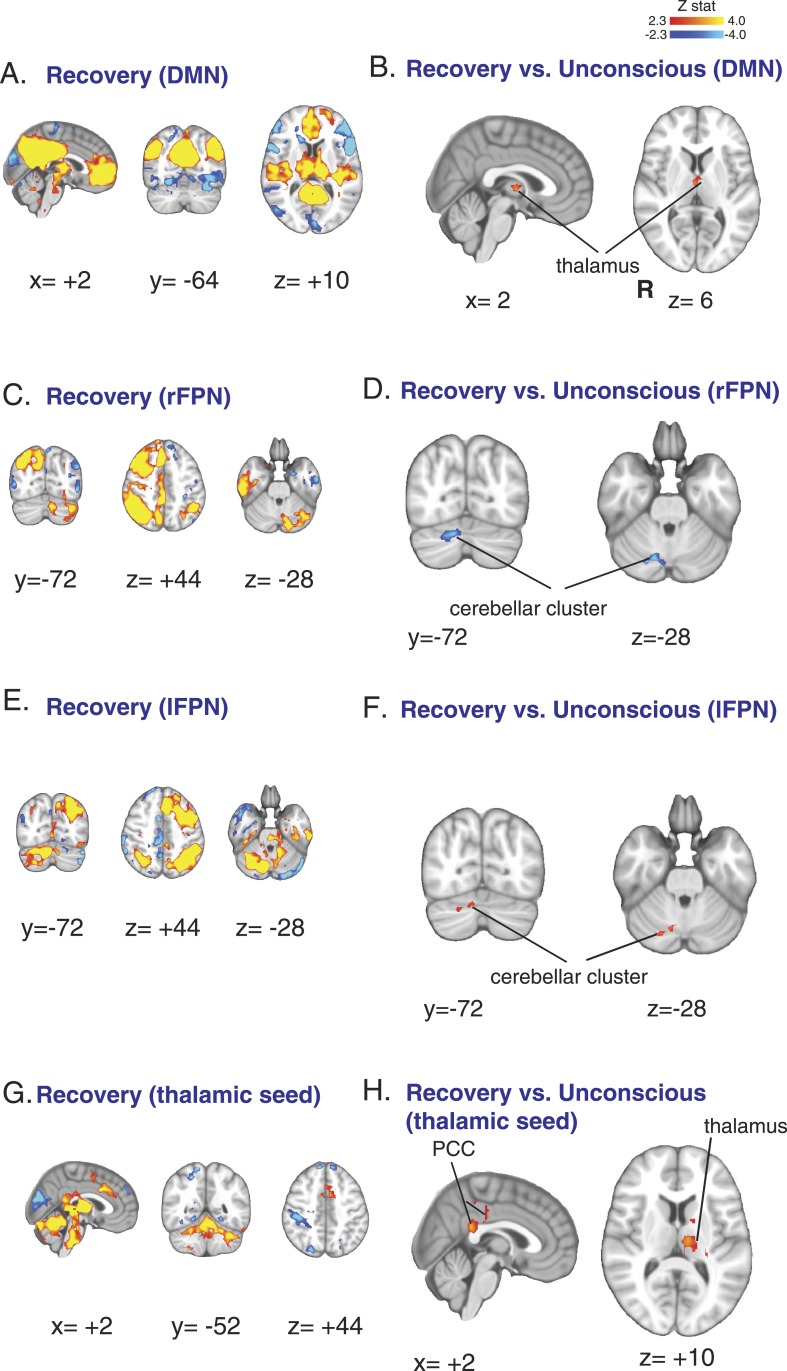
Understanding the neural basis of consciousness is fundamental to neuroscience research. Disruptions in cortico-cortical connectivity have been suggested as a primary mechanism of unconsciousness. By using a novel combination of positron emission tomography and functional magnetic resonance imaging, we studied anesthesia-induced unconsciousness and recovery using the α₂-agonist dexmedetomidine. During unconsciousness, cerebral metabolic rate of glucose and cerebral blood flow were preferentially decreased in the thalamus, the Default Mode Network (DMN), and the bilateral Frontoparietal Networks (FPNs). Cortico-cortical functional connectivity within the DMN and FPNs was preserved. However, DMN thalamo-cortical functional connectivity was disrupted. Recovery from this state was associated with sustained reduction in cerebral blood flow and restored DMN thalamo-cortical functional connectivity. We report that loss of thalamo-cortical functional connectivity is sufficient to produce unconsciousness.

Keywords: consciousness; cortico-cortical; default mode network; dexmedetomidine; functional connectivity; human; neuroscience; thalamo-cortical.


Conflict of interest statement

The author declare that no competing interests exist.

Figures

Figure 1.
Figure 1.. Schematic of dexmedetomidine signaling illustrating similarities to the mechanism proposed for the generation of non-rapid eye movement II sleep.
Dexmedetomidine binds to α2 receptors on neurons emanating from the locus ceruleus to inhibit NE release in the POA. The disinhibited POA reduces arousal by means of GABA- and galanin-mediated inhibition of the midbrain, hypothalamic, and pontine arousal nuclei. Dexmedetomidine also acts at the locus ceruleus projections to the intralaminar nucleus of the hypothalamus, the basal forebrain and the cortex and on post-synaptic α2 receptors. 5HT, serotonin; Ach, acetylcholine; BF, basal forebrain; DA, dopamine; Dex; dexmedetomidine; DR, dorsal raphe; GABA, gamma aminobutyric acid receptor subtype A; Gal, galanin; His, histamine; LC, locus ceruleus; LDT, laterodorsal tegmental area; NE, norepinephrine; PAG, periaqueductal gray; POA, preoptic area; PPT, pedunculopontine tegmental area; TMN, tuberomamillary nucleus. DOI: http://dx.doi.org/10.7554/eLife.04499.003
Figure 2.
Figure 2.. CMRglc and rCBF are decreased in both the default mode and the frontal–parietal network brain regions during unconsciousness.
(A) Study outline of healthy volunteers recruited to undergo both baseline and dexmedetomidine-induced unconsciousness PET brain imaging in a random order. (B) Group wise (n = 10) dexmedetomidine-induced unconsciousness vs baseline changes in CMRglc (PET) displayed on the MNI152 standard volume. Significant CMRglc decreases were localized to brain regions that make up the Default Mode and the Frontal-Parietal Networks. (C) Schematic of fMRI obtained concurrently in combined PET/MR visits (n = 10) and MR/only visits (n = 7). (D) Group wise (n = 17) dexmedetomidine-induced unconsciousness vs awake changes in rCBF (fMRI) displayed on the MNI152 standard volume. Significant rCBF decreases were also localized to brain regions that make up the Default Mode and the Frontal-Parietal Networks. The brain regions that were not included in the rCBF estimation are shaded in the darker hue. ACC, anterior cingulate cortex; CMRglc, cerebral metabolic rate of glucose; Dex, dexmedetomidine; dmPFC, dorsomedial prefrontal cortex; fMRI, functional magnetic resonance; IPL, infraparietal lobule; IPL, infraparietal sulcus; PCC, posterior cingulate cortex; R, right; rCBF, regional cerebral blood flow; RSC, restrosplenial cortex; vmPFC, ventromedial prefrontal cortex. DOI: http://dx.doi.org/10.7554/eLife.04499.004
Figure 2—figure supplement 1.
Figure 2—figure supplement 1.. PET SUV changes during unconsciousness.
(A) Group wise (n = 10) Dexmedetomidine-induced unconsciousness vs baseline changes in SUV (PET) displayed on the MNI152 standard volume highlighting that only SUV decreases were notable during unconsciousness. (B) Group wise (n = 10) baseline and dexmedetomidine-induced changes in CMRglc (PET) displayed on the MNI152 standard volume. MNI, Montreal neurological institute; PET, positron emission tomography; SUV ,standardized uptake value. DOI: http://dx.doi.org/10.7554/eLife.04499.005
Figure 3.
Figure 3.. Changes in the default mode and the bilateral frontal parietal networks during unconsciousness.
(A) The DMN extracted from BOLD signals during the awake (n = 16) and unconscious states (n = 16) and displayed on the MNI152 standard volume. (B) A comparison the DMN network during the unconscious vs the awake state identified the putamen and the vlPFC as regions that exhibited increased functional connectivity during dexmedetomidine-induced unconsciousness. This comparison also identified the thalamus and the cerebellar representation of this network as regions that exhibited decreased functional connectivity during dexmedetomidine-induced unconsciousness. Cortico–cortico functional connectivity within this network was maintained. (C) The right FPN extracted from BOLD signals during the awake and unconscious states (n = 16) and displayed on the MNI152 standard volume. (D) A comparison of the right FPN network during the unconscious vs the awake state identified the infraparietal lobule and a right cerebellar cluster as regions that exhibited increased functional connectivity during dexmedetomidine-induced unconsciousness. This comparison also identified the cerebellar representation of this network as a region that exhibited decreased functional connectivity during unconsciousness. Cortico–cortico functional connectivity within this network was maintained. (E) The left FPN extracted from BOLD signals during the awake and unconscious states (n = 16) and displayed on the MNI152 standard volume. (F) A comparison of the left FPN network during the unconscious vs the awake state identified a right cerebellar cluster and the cerebellar representation of the left FPN as regions that exhibited decreased functional connectivity during dexmedetomidine-induced unconsciousness. Cortico–cortico functional connectivity within this network was maintained. BOLD, blood oxygen level dependent; DMN, default mode network; FPN, Frontoparietal Network; R, right; vlPFC, ventrolateral prefrontal cortex. DOI: http://dx.doi.org/10.7554/eLife.04499.008
Figure 3—figure supplement 1.
Figure 3—figure supplement 1.. SUV, CMRglc, rCBF changes during unconsciousness and the relationship to the DMN and bilateral FCNs.
(A) Surface projection of the voxelwise, cluster corrected analysis illustrating overlapping decreases in CMRglc (n = 10) and rCBF (n = 17) in regions corresponding to the DMN, and the bilateral FCNs during unconsciousness. (B) Surface projection of the DMN, rFCN and lFCN extracted from study volunteers (n = 17). These networks were identified from the awake, unconscious, and recovery state BOLD signals.CMRglc, cerebral metabolic rate of glucose; dlPFC, dorsolateral prefrontal cortex; dmPFC, dorsomedial prefrontal cortex; DMN, default mode network; FPN, frontoparietal network; IPL, infraparietal lobule; IPL, infraparietal sulcus; MNI, Montreal neurological institute; PCC, posterior cingulate cortex; rCBF, regional cerebral blood flow; R, right; RSC, retrosplenial cortex; vlPFC, ventrolateral prefrontal cortex, vmPFC, ventromedial prefrontal cortex. DOI: http://dx.doi.org/10.7554/eLife.04499.009
Figure 4.
Figure 4.. Seed based functional connectivity analysis of the brain region with overlapping changes in CMRglc, rCBF, and functional connectivity.
(A) Brain wide representation of regions connected to the thalamic seed during the awake and unconscious states (n = 16). A comparison of thalamic seed functional connectivity during the unconscious vs the awake state identified the PCC, precuneus, thalamus, visual cortex, IPL and IPS as regions exhibiting decreased functional connectivity during unconsciousness. (B) Overlap of the brain regions with changes in CMRglc, rCBF, and functional connectivity. Notably, the posterior thalamus, PCC and the precuneus exhibited overlapping changes. CMRglc, cerebral metabolic rate of glucose; IPL, infraparietal lobule; IPL, infraparietal sulcus; PCC, posterior cingulate cortex; R, right; rCBF, regional cerebral blood flow. DOI: http://dx.doi.org/10.7554/eLife.04499.013
Figure 5.
Figure 5.. Cortical increase in rCBF is not evident during the recovery of consciousness.
(A) Cluster corrected (n = 10) rCBF comparison of the recovery state vs the unconsciousness state displayed on the MNI152 standard volume highlighting no change in rCBF at recovery. (B) Uncorrected (n = 10) rCBF comparison of the recovery state vs the unconsciousness state displayed on the MNI152 standard volume suggesting that a decrease in rCBF occurred during the recovery state. (C) Cluster corrected (n = 10) rCBF comparison of the recovery state vs the awake state displayed on the MNI152 standard volume highlighting a spatial distribution of rCBF decrease similar to that observed during unconscious vs the awake state (n = 17) comparison. IPL, infraparietal lobule; IPL, infraparietal sulcus; PCC, posterior cingulate cortex; rCBF, regional cerebral blood flow; R, right; RSC, retrosplenial cortex. The brain coverage of rCBF estimation is shown in Figure 1D. DOI: http://dx.doi.org/10.7554/eLife.04499.015
Figure 5—figure supplement 1.
Figure 5—figure supplement 1.. Cortical decrease in rCBF persists during the recovery of consciousness.
Statistically significant rCBF clusters from Figure 1D were extracted and intersected with the Harvard–Oxford cortical and subcortical map arbitrarily thresholded at 30. Subjects were aligned to LOC/ROC and then median baseline normalized rCBF values obtained for each time point. For LOC (n = 17) and ROC (n = 16), an average of baseline-normalized rCBF values corresponding to the 2 min immediately preceding and post LOC/ROC behavioral time points are represented. The decreased rCBF values from baseline observed during the LOC were sustained during the ROC. L, left; LOC, loss of consciousness; Post, posterior; rCBF, regional cerebral blood flow; R, right; ROC, return of consciousness. DOI: http://dx.doi.org/10.7554/eLife.04499.016
Figure 6.
Figure 6.. Functional connectivity changes observed during recovery of consciousness.
(A) The DMN extracted from BOLD signals obtained during the recovery state (n = 15) displayed on the MNI152 standard volume. (B) A comparison the DMN network during the recovery vs the awake state identified the thalamus as the only region with partial recovery of functional connectivity. (C) The right FPN extracted from BOLD signals during the recovery state (n = 15) and displayed on the MNI152 standard volume. (D) A comparison of the right FPN during the recovery vs the awake state showed that right cerebellar cluster from Figure 3B,C now exhibited decreased right FPN functional connectivity. (E) The left FPN extracted from BOLD signals during the recovery state (n = 15) and displayed on the MNI152 standard volume. (F) A comparison of the left FPN during the recovery vs the awake state showed that right cerebellar cluster from Figure 3B,C now exhibited increased left FPN functional connectivity. (G) Brain wide representation of regions connected to the thalamic seed during the recovery state (n = 15) displayed on the MNI152 standard volume. (H) A comparison of thalamic seed functional connectivity during the recovery vs the awake state identified the PCC and thalamus as regions with increased functional connectivity at recovery. BOLD, blood oxygen level dependent; DMN, default mode network; FPN, Frontoparietal Network; PCC, posterior cingulate cortex; R, right. DOI: http://dx.doi.org/10.7554/eLife.04499.017
Author response image 1.

Similar articles

Cited by

References

    1. Akeju O, Pavone KJ, Westover MB, Vazquez R, Prerau MJ, Harrell PG, Hartnack KE, Rhee J, Sampson AL, Habeeb K, Lei G, Pierce ET, Walsh JL, Brown EN, Purdon PL. A comparison of propofol- and dexmedetomidine-induced electroencephalogram dynamics using Spectral and Coherence analysis. Anesthesiology. 2014;121:978–989. doi: 10.1097/ALN.0000000000000419. - DOI - PMC - PubMed
    1. Alkire MT, Haier RJ, Fallon JH. Toward a unified theory of narcosis: brain imaging evidence for a thalamocortical switch as the neurophysiologic basis of anesthetic-induced unconsciousness. Consciousness and Cognition. 2000;9:370–386. doi: 10.1006/ccog.1999.0423. - DOI - PubMed
    1. Alkire MT, Hudetz AG, Tononi G. Consciousness and anesthesia. Science. 2008;322:876–880. doi: 10.1126/science.1149213. - DOI - PMC - PubMed
    1. Beckmann CF, DeLuca M, Devlin JT, Smith SM. Investigations into resting-state connectivity using independent component analysis. Philosophical Transactions of the Royal Society of London. Series B, Biological Sciences. 2005;360:1001–1013. doi: 10.1098/rstb.2005.1634. - DOI - PMC - PubMed
    1. Beecher HK. Anesthesia's second power: probing the mind. Science. 1947;105:164–166. doi: 10.1126/science.105.2720.164. - DOI - PubMed

Publication types

MeSH terms

LinkOut - more resources