. 2015 Apr;25(4):1023-31.
doi: 10.1007/s00330-014-3510-5. Epub 2014 Nov 29.

Contrast agent and radiation dose reduction in abdominal CT by a combination of low tube voltage and advanced image reconstruction algorithms

Affiliations

Contrast agent and radiation dose reduction in abdominal CT by a combination of low tube voltage and advanced image reconstruction algorithms

Nico Buls et al. Eur Radiol. 2015 Apr.

Abstract

Objectives: To assess image quality in abdominal CT at low tube voltage combined with two types of iterative reconstruction (IR) at four reduced contrast agent dose levels.

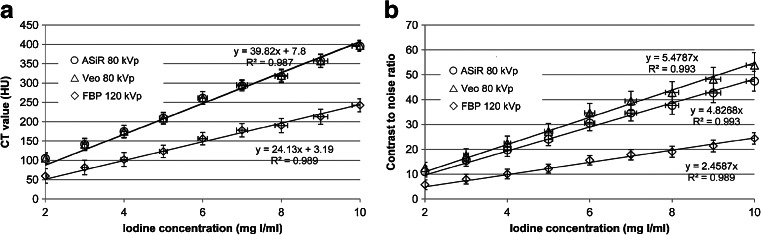
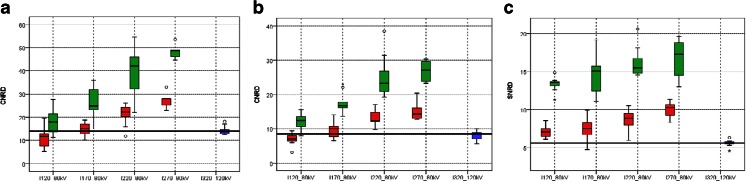
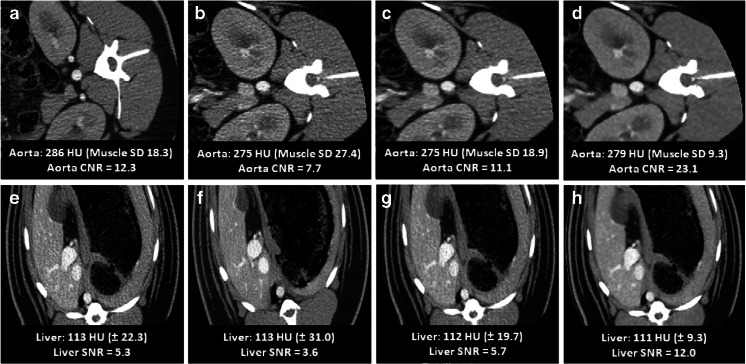
Methods: Minipigs were scanned with standard 320 mg I/mL contrast concentration at 120 kVp, and with reduced formulations of 120, 170, 220 and 270 mg I/mL at 80 kVp with IR. Image quality was assessed by CT value, dose normalized contrast and signal to noise ratio (CNRD and SNRD) in the arterial and venous phases. Qualitative analysis was included by expert reading.

Results: Protocols with 170 mg I/mL or higher showed equal or superior CT values: aorta (278-468 HU versus 314 HU); portal vein (205-273 HU versus 208 HU); liver parenchyma (122-146 HU versus 115 HU). In the aorta, all 170 mg I/mL protocols or higher yielded equal or superior CNRD (15.0-28.0 versus 13.7). In liver parenchyma, all study protocols resulted in higher SNRDs. Radiation dose could be reduced from standard CTDIvol = 7.8 mGy (6.2 mSv) to 7.6 mGy (5.2 mSv) with 170 mg I/mL.

Conclusion: Combining 80 kVp with IR allows at least a 47 % contrast agent dose reduction and 16 % radiation dose reduction for images of comparable quality.

Key points: • There is a balance between image quality, contrast dose and radiation dose. • Iterative reconstruction has a major, positive impact on this balance. • Both contrast dose and radiation dose can be reduced in abdominal CT. • The trade-off can be quantitatively described by a 3D model. • Contrast and radiation dose can be tailored according to specific safety concerns.


Figures

Fig. 1
Fig. 1
Mean CT value (a) and contrast to noise ratio (b) as a function of iodine concentration for FBP at 120 kVp and both ASiR and Veo at 80 kVp, obtained from phantom data. Error bars represent 95 % confidence intervals
Fig. 2
Fig. 2
Box and whisker plots of CT enhancement in abdominal aorta (a), portal vein (b) and liver parenchyma (c). Each protocol is labeled by its combination of iodine concentration (I from 120 to 320 mg I/mL) and tube voltage (80 or 120 kVp). The solid line in the box represents the median value and the upper and lower bars represent the first and third quartiles respectively, whiskers represent the 95 % confidence interval. The bold reference line in the graph represents the median value of the reference protocol
Fig. 3
Fig. 3
Box and whisker plots of radiation dose normalized quantitative image quality (CNRD and SNRD) in abdominal aorta (a), portal vein (b) and liver parenchyma (c) with ASiR (red boxes) and Veo (green boxes) reconstruction. Each protocol is indicated by its combination of iodine concentration (I from 120 to 320 mg I/mL) and tube voltage (80 or 120 kVp). The solid line in the box represents the median value and the upper and lower bars represent the first and third quartiles respectively, whiskers represent the 95 % confidence interval. The bold reference line in the graph represents the median value of the reference protocol
Fig. 4
Fig. 4
Colour-coded 3D surface plots of the CNR and SNR from the 80-kVp study protocols for the abdominal aorta in the hepato-arterial phase (ac) and the liver parenchyma in the portal phase (df). For each structure, the results for FBP (a, d), ASiR (b, e) and Veo (c, f) reconstruction are shown. Each data point is represented by an asterisk. The solid curved line in each graph represents the observed CNR (13.7) and SNR (5.6) values of the reference protocol extrapolated to a CTDIvol of 8.0 mGy. Any radiation–concentration combination above that line yields improved image quality compared to the reference protocol
Fig. 5
Fig. 5
120 kVp, 320 mg I/mL reference protocol compared to 80 kVp, 170 mg I/mL study protocol. a Arterial and e venous phase images obtained with the reference protocol of 120 kVp, 320 mg I/mL, CTDIvol = 7.2 mGy and FBP reconstruction. bd Arterial and f, g venous phase images obtained with a study protocol of 80 kVp, 170 mg I/mL, CTDIvol = 5.9 mGy and FBP (b, f) reconstruction, ASiR (c, g) reconstruction and Veo (d, h) reconstruction. Recorded CT values, noise, CNR and SNR are shown on each image. Note the reduced quality of the 80-kVp FBP images (b, f), which is restored by ASiR (c, g) and Veo (d, h) reconstruction

References

    1. Bae KT. Intravenous contrast medium administration and scan timing at CT: considerations and approaches. Radiology. 2010;256:32–61. doi: 10.1148/radiol.10090908. - DOI - PubMed
    1. Nakaura T, Awai K, Maruyama N, et al. Abdominal dynamic CT in patients with renal dysfunction: contrast agent dose reduction with low tube voltage and high tube current‐time product settings at 256‐detector row CT. Radiology. 2011;261:467–476. doi: 10.1148/radiol.11110021. - DOI - PubMed
    1. Nakayama Y, Awai K, Funama Y, et al. Abdominal CT with low tube voltage: preliminary observations about radiation dose, contrast enhancement, image quality, and noise. Radiology. 2005;237:945–951. doi: 10.1148/radiol.2373041655. - DOI - PubMed
    1. Waaijer A, Prokop M, Velthuis BK, et al. Circle of Willis at CT angiography: dose reduction and image quality—reducing tube voltage and increasing tube current settings. Radiology. 2007;242:832–839. doi: 10.1148/radiol.2423051191. - DOI - PubMed
    1. Marin D, Nelson RC, Barnhart H, et al. Detection of pancreatic tumors, image quality, and radiation dose during the pancreatic parenchymal phase: effect of a low‐tube‐voltage, high‐tube‐current CT technique–preliminary results. Radiology. 2010;256:450–459. doi: 10.1148/radiol.10091819. - DOI - PubMed

Publication types