

Impact of biodiversity and seasonality on Lyme-pathogen transmission
- PMID: 25432469
- PMCID: PMC4396072
- DOI: 10.1186/1742-4682-11-50
Impact of biodiversity and seasonality on Lyme-pathogen transmission
Abstract
Lyme disease imposes increasing global public health challenges. To better understand the joint effects of seasonal temperature variation and host community composition on the pathogen transmission, a stage-structured periodic model is proposed by integrating seasonal tick development and activity, multiple host species and complex pathogen transmission routes between ticks and reservoirs. Two thresholds, one for tick population dynamics and the other for Lyme-pathogen transmission dynamics, are identified and shown to fully classify the long-term outcomes of the tick invasion and disease persistence. Seeding with the realistic parameters, the tick reproduction threshold and Lyme disease spread threshold are estimated to illustrate the joint effects of the climate change and host community diversity on the pattern of Lyme disease risk. It is shown that climate warming can amplify the disease risk and slightly change the seasonality of disease risk. Both the "dilution effect" and "amplification effect" are observed by feeding the model with different possible alternative hosts. Therefore, the relationship between the host community biodiversity and disease risk varies, calling for more accurate measurements on the local environment, both biotic and abiotic such as the temperature and the host community composition.
Figures
 and
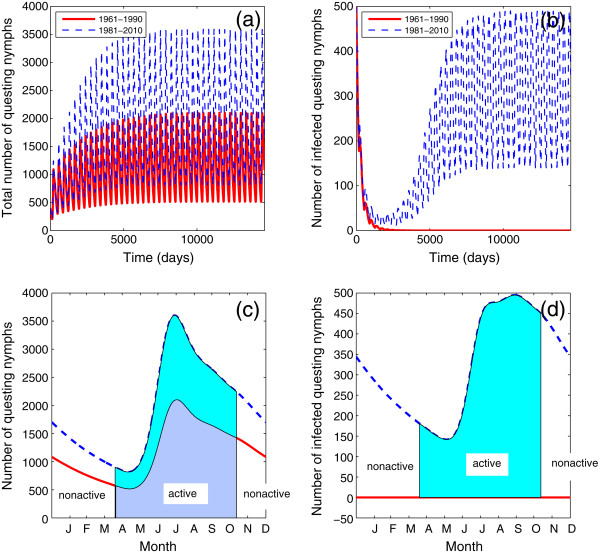
and  in this case), while the blue dashed curves represent the model outputs by 1981−2010 temperature data (
 and
and  in this case). (a) Total questing nymphs; (b) infected questing nymphs in the 40 year simulation; (c) seasonality of questing nymphs at the steady state; (d) seasonality of infected questing nymphs at the steady state, where shaded portions in both (c) and (d) represent the active seasons of the questing nymphs.
 and
and
 against the number of alternative hosts. In the case of the eastern chipmunks, p
1=0.4, p
2=3.5,
against the number of alternative hosts. In the case of the eastern chipmunks, p
1=0.4, p
2=3.5,  ,
,  ,
,  ; for the western fence lizard, p
1=1, p
2=1,
; for the western fence lizard, p
1=1, p
2=1,  ,
,  ,
,  ; for the Virginia opossum, p
1=7.2, p
2=36.9,
; for the Virginia opossum, p
1=7.2, p
2=36.9,  ,
,  ,
,  . For all simulations, the temperature condition is fixed on the period 1981−2010.
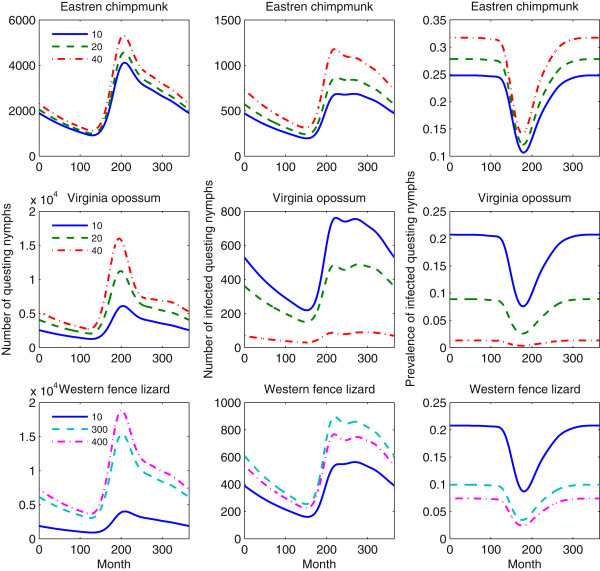

 ,
p
1
and
p
2
for the three types of alternative hosts: the eastern chipmunk, the Virginia opossum and the western fence lizard. The number of alternative hosts is set as 30 and all other parameter values are same as those in Figure 5.
,
p
1
and
p
2
for the three types of alternative hosts: the eastern chipmunk, the Virginia opossum and the western fence lizard. The number of alternative hosts is set as 30 and all other parameter values are same as those in Figure 5.References
-
- Ogden NH, Bigras-Poulin M, O’Callaghan CJ, Barker IK, Lindsay LR, Maarouf A, Smoyer-Tomic KE, Waltner-Toews D, Charron D. A dynamic population model to investigate effects of climate on geographic range and seasonality of the tick Ixodes scapularis. Int J Parasitol. 2005;35:375–389. doi: 10.1016/j.ijpara.2004.12.013. - DOI - PubMed
-
- CDC Summary of notifiable diseases–United States, 2010. Morb Mortal Wkly Rep. 2012;59:1–111. - PubMed
-
- Ostfeld RS. Lyme Disease: The Ecology of a Complex System. New York: Oxford University Press; 2011.
Publication types
MeSH terms
LinkOut - more resources
Full Text Sources
Other Literature Sources
Medical
