

Potential of fecal microbiota for early-stage detection of colorectal cancer
- PMID: 25432777
- PMCID: PMC4299606
- DOI: 10.15252/msb.20145645
Potential of fecal microbiota for early-stage detection of colorectal cancer
Abstract
Several bacterial species have been implicated in the development of colorectal carcinoma (CRC), but CRC-associated changes of fecal microbiota and their potential for cancer screening remain to be explored. Here, we used metagenomic sequencing of fecal samples to identify taxonomic markers that distinguished CRC patients from tumor-free controls in a study population of 156 participants. Accuracy of metagenomic CRC detection was similar to the standard fecal occult blood test (FOBT) and when both approaches were combined, sensitivity improved > 45% relative to the FOBT, while maintaining its specificity. Accuracy of metagenomic CRC detection did not differ significantly between early- and late-stage cancer and could be validated in independent patient and control populations (N = 335) from different countries. CRC-associated changes in the fecal microbiome at least partially reflected microbial community composition at the tumor itself, indicating that observed gene pool differences may reveal tumor-related host-microbe interactions. Indeed, we deduced a metabolic shift from fiber degradation in controls to utilization of host carbohydrates and amino acids in CRC patients, accompanied by an increase of lipopolysaccharide metabolism.
Keywords: cancer screening; colorectal cancer; fecal biomarkers; human gut microbiome; metagenomics.
© 2014 The Authors. Published under the terms of the CC BY 4.0 license.
Figures
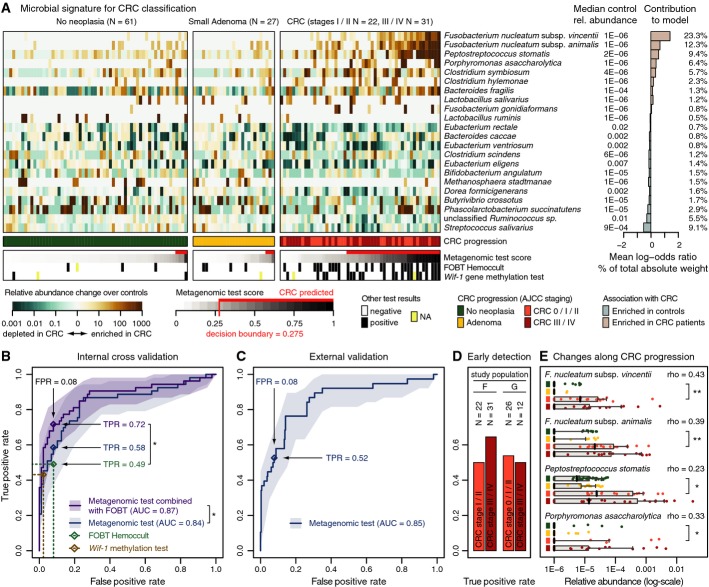
Relative abundances of 22 gut microbial species, collectively associated with CRC, are displayed as heatmap in the left panel as fold change over the median relative abundance observed in controls (indicated to the right); the control group included neoplasia-free and small adenoma patients. The mean contribution of each marker species to the classification is shown to the right (bars correspond to log-odds ratio in logistic regression; numbers indicate percentage of absolute total weight, see Materials and Methods). Different cancer stages are color-coded below the heatmap (see Table 1, Supplementary Table S1 and Supplementary Dataset S1 for patient data). Below, the classification score of the microbial signature (from cross-validation) is shown as gray scale (see key) with the decision boundary and resulting false positives and true positives indicated in red (using colonoscopy results as a ground truth). Displayed alongside are the results of the standard Hemoccult FOBT routinely applied for CRC screening and an experimental CRC screening test based on methylation of the wif-1 gene, a Wnt pathway member (Lee et al, ; Mansour & Sobhani, 2009) (see main text for details).
Test accuracy of the metagenomic classifier is depicted as ROC curve summarizing mean test predictions made in ten times resampled tenfold cross-validation on study population F (N = 141, 95% confidence intervals of true-positive rate are shaded, see Materials and Methods and Table 1). Additionally, the accuracy of the wif-1 methylation test (Lee et al, ; Mansour & Sobhani, 2009) as well as of the FOBT is shown (as assessed for the same patients). A combination test, in which the FOBT results and microbial abundance profiles were jointly used as predictors, resulted in significantly enhanced accuracy over both the metagenomic classifier and the FOBT alone, compared to which the relative gain in sensitivity is > 45% at the same specificity (*denotes one-sided bootstrapping P-values < 0.05 of TPR improvement over FOBT and of difference in the whole ROC curve to the metagenomic test, respectively, see Materials and Methods). All screening tests are evaluated relative to colonoscopy findings (see key and main text for details; see also Supplementary Figs S4, S5 and S6 for additional details on the classifier, and Table 1, Supplementary Table S1 and Supplementary Dataset S1 for patient data).
When applied to the larger study populations G and H (335 metagenomes from several countries including 38 from German CRC patients) for external validation, the metagenomic classifier achieved very similar accuracy as in cross-validation, as measured by the area under the ROC curve (AUC) of mean test prediction scores (ROC curve and confidence intervals as in (A); see also Supplementary Figs S5 and S6 and Table 1, Supplementary Table S1 and Supplementary Dataset S1).
Sensitivity (TPR) of the metagenomic classifier for carcinomas in early stages (AJCC stages 0, I, and II) was similar as for late-stage, metastasizing CRC (AJCC stages III and IV) in both study populations F and G highlighting its potential utility for early detection (see also Table 1, Supplementary Table S1 and Supplementary Dataset S1).
Although the classifier associated species with a binary grouping into cancer and non-cancer patients, several of them exhibited gradual abundance changes over the progression from neoplasia-free participants over adenoma to early- and late-stage cancer patients (see key below A); displayed are the 4 most discriminative CRC marker species, each of which shows a Spearman correlation (rho) with cancer progression (grouped as in A) that is stronger than 0.2 with P-values < 0.001. Significant changes in early-stage CRC patients compared to neoplasia-free controls are marked (*P < 0.05, **P < 1E-5, Wilcoxon test). Vertical black lines indicate median relative abundance with gray boxes denoting the inter-quartile range; gray whiskers extend to the 5th and 95th percentile (see also Supplementary Fig S7).
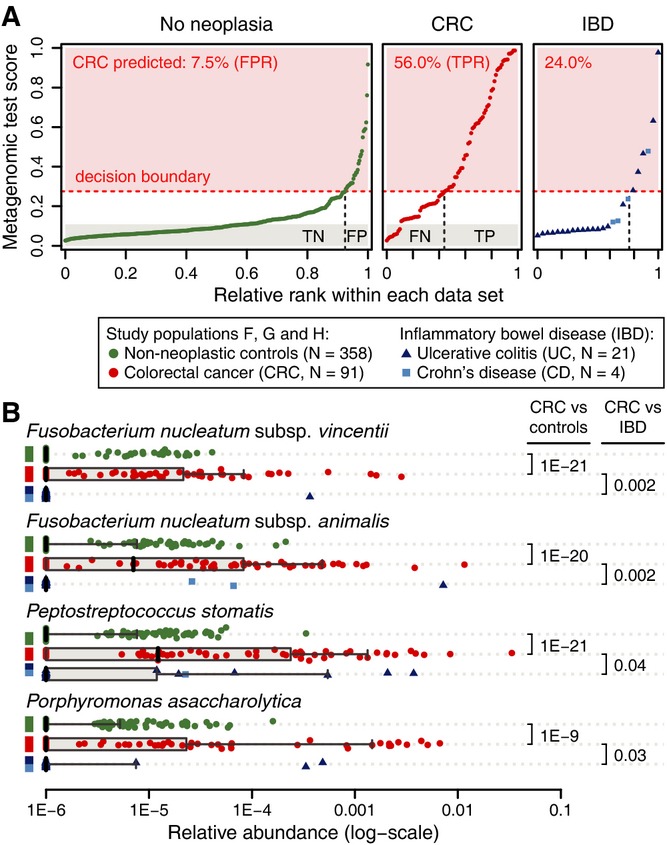
Ranked predictions of the metagenomic classifier (mean test prediction for study populations F, G and H) are plotted for each individual (labels on top indicate grouping) with the percentage of positive CRC predictions annotated in red. Proportions of true negatives (TN), false positives (FP), false negatives (FN), and true positives (TP) are shown at the bottom for a decision boundary of 0.275 (see Fig 1). Application of the CRC classifier to metagenomes from ulcerative colitis (UC) and Crohn's disease (CD) patients indicates a threefold increased false-positive rate for inflammatory bowel disease (IBD) patients, suggesting some similarities between CRC and IBD.
Relative abundance distributions of the four most discriminative markers for CRC classification (see Fig 1A) are plotted for each patient subgroup, including UC and CD (see key). All markers showed significantly stronger association with (enrichment in) CRC than with IBD (Wilcoxon test, UC and CD tested together; see also Supplementary Fig S8). Boxplots are as defined in Fig 1E.
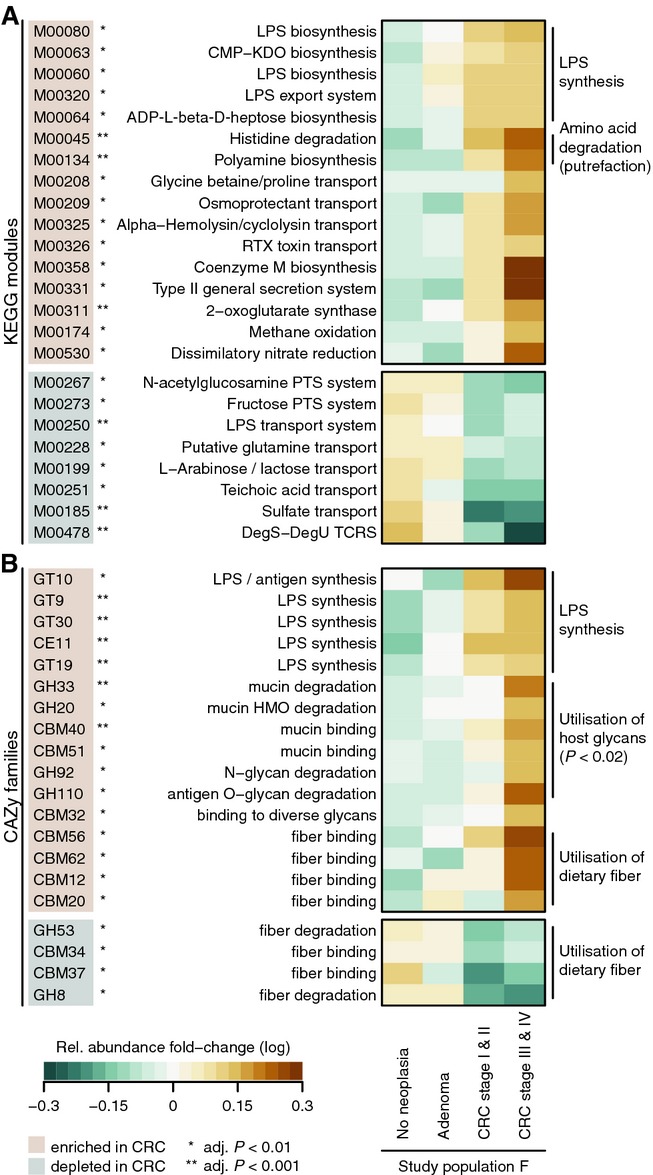
Significant changes in relative abundance of genes summarized by KEGG module annotations between cancer and non-cancer metagenomes are shown for cases with a > 1.33-fold change and an FDR-adjusted P-value < 0.01 (see legend and Materials and Methods). General trends in functional potential, such as enrichment of lipopolysaccharide (LPS) metabolism, and putrefaction in the CRC microbiome are summarized to the right of the heatmap.
Significant relative abundance changes of genes summarized by CAZy family annotation with a > 1.33-fold change and an FDR-adjusted P-value < 0.01 (see Materials and Methods). A metabolic switch to degradation of host carbohydrates, for example, mucins, in CRC metagenomes is annotated to the right. Moreover, a CRC-associated increase in metabolism of potentially pro-inflammatory bacterial cell wall components, such as lipopolysaccharide (LPS), is evident. Together with an increase of nitrate reduction in CRC metagenomes (A), this is consistent with a bloom of Proteobacteria (see also Supplementary Figs S2 and S3).
References
-
- Abubucker S, Segata N, Goll J, Schubert AM, Izard J, Cantarel BL, Rodriguez-Mueller B, Zucker J, Thiagarajan M, Henrissat B, White O, Kelley ST, Methe B, Schloss PD, Gevers D, Mitreva M, Huttenhower C. Metabolic reconstruction for metagenomic data and its application to the human microbiome. PLoS Comp Biol. 2012;8:e1002358. - PMC - PubMed
-
- Allison JE, Tekawa IS, Ransom LJ, Adrain AL. A comparison of fecal occult-blood tests for colorectal-cancer screening. New Engl J Med. 1996;334:155–159. - PubMed
-
- Allison JE, Sakoda LC, Levin TR, Tucker JP, Tekawa IS, Cuff T, Pauly MP, Shlager L, Palitz AM, Zhao WK, Schwartz JS, Ransohoff DF, Selby JV. Screening for colorectal neoplasms with new fecal occult blood tests: update on performance characteristics. J Natl Cancer Inst. 2007;99:1462–1470. - PubMed
-
- Altschul SF, Gish W, Miller W, Myers EW, Lipman DJ. Basic local alignment search tool. J Mol Biol. 1990;215:403–410. - PubMed
-
- Arthur JC, Perez-Chanona E, Muhlbauer M, Tomkovich S, Uronis JM, Fan TJ, Campbell BJ, Abujamel T, Dogan B, Rogers AB, Rhodes JM, Stintzi A, Simpson KW, Hansen JJ, Keku TO, Fodor AA, Jobin C. Intestinal inflammation targets cancer-inducing activity of the microbiota. Science. 2012;338:120–123. - PMC - PubMed
Publication types
MeSH terms
Grants and funding
LinkOut - more resources
Full Text Sources
Other Literature Sources
Medical
