

Regulation of Drosophila intestinal stem cell maintenance and differentiation by the transcription factor Escargot
- PMID: 25433031
- PMCID: PMC4282644
- DOI: 10.15252/embj.201489050
Regulation of Drosophila intestinal stem cell maintenance and differentiation by the transcription factor Escargot
Abstract
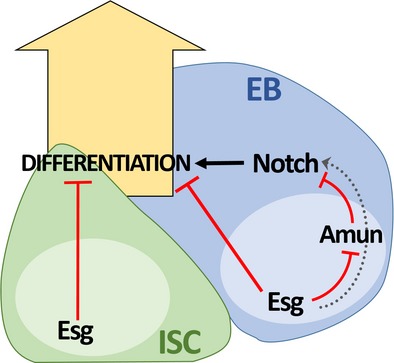
Tissue stem cells divide to self-renew and generate differentiated cells to maintain homeostasis. Although influenced by both intrinsic and extrinsic factors, the genetic mechanisms coordinating the decision between self-renewal and initiation of differentiation remain poorly understood. The escargot (esg) gene encodes a transcription factor that is expressed in stem cells in multiple tissues in Drosophila melanogaster, including intestinal stem cells (ISCs). Here, we demonstrate that Esg plays a pivotal role in intestinal homeostasis, maintaining the stem cell pool while influencing fate decisions through modulation of Notch activity. Loss of esg induced ISC differentiation, a decline in Notch activity in daughter enteroblasts (EB), and an increase in differentiated enteroendocrine (EE) cells. Amun, an inhibitor of Notch in other systems, was identified as a target of Esg in the intestine. Decreased expression of esg resulted in upregulation of Amun, while downregulation of Amun rescued the ectopic EE cell phenotype resulting from loss of esg. Thus, our findings provide a framework for further comparative studies addressing the conserved roles of Snail factors in coordinating self-renewal and differentiation of stem cells across tissues and species.
Keywords: Amun; Drosophila; Escargot; Notch; stem cell.
© 2014 The Authors.
Figures
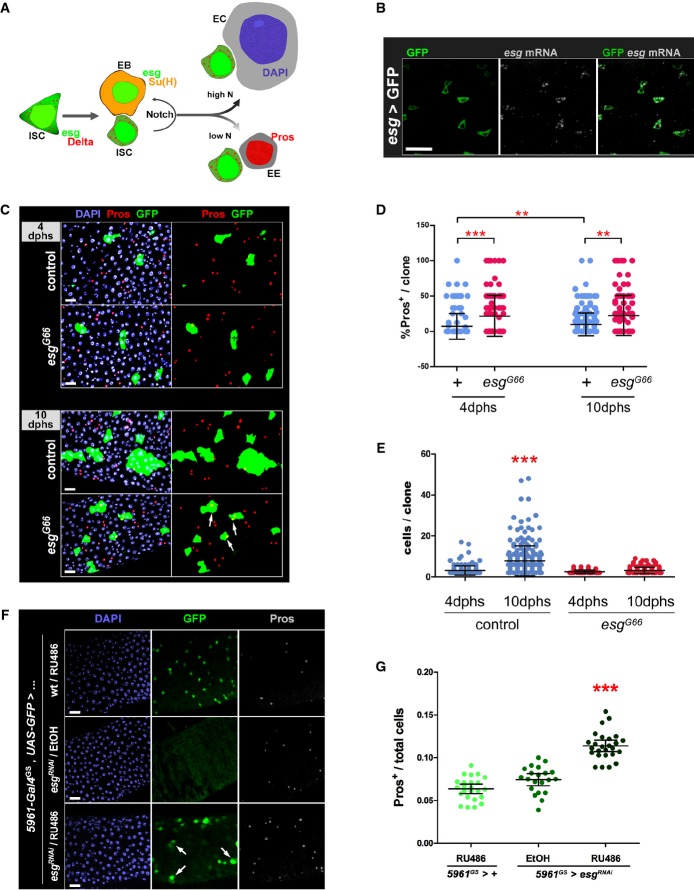
A Drosophila posterior midgut epithelium. Schematic representation of cell types and their lineage relationships (see text for details; Micchelli & Perrimon, ; Ohlstein & Spradling, 2006). Intestinal stem cells (ISCs) and enteroblasts (EBs) can be usually identified by an esg-GFP reporter, or expression of GFP under control of ISC/EB-specific drivers. ISCs express Delta (Dl, which results in a characteristic punctate staining of ISCs), which activates Notch in EBs (revealed by β-GAL staining of flies that carry a Su(H)-lacZ reporter of Notch activity (Bray & Furriols, 2001)). Enteroendocrine cells (EE) are identified by nuclear Prospero (Pros) staining, whereas enterocytes (ECs) can be distinguished based on their large polyploidy nuclei (as revealed by DAPI staining of DNA).
B esg mRNA is restricted to ISC/EB cells. FISH/IF staining for esg mRNA (red, gray) and GFP protein (green) in midguts of 3- to 5-day-old adults carrying an ISC/EB-specific reporter (“esg > GFP” = esg-Gal4, UAS-GFP).
C Clonal analysis of esg mutant ISCs. Representative images of wild-type (control) and esg mutant (esgG66) MARCM clones stained as indicated with DAPI, Pros and GFP, 4 or 10 days after heat shock (dphs). esgG66 mutant clones are smaller and contain EE cells more frequently than controls (arrows).
D, E Loss of esg results in loss of ISCs and an increase in EE cells. A CellProfiler analysis of images as those in (C) confirmed that esgG66 mutant clones are significantly enriched for EE cells (D) and have significantly less cells (E) than their control counterparts (***P < 0.001 and **P < 0.01, Kruskal–Wallis/Dunn test).
F, G Phenotypes induced by RNAi-mediated depletion of esg in ISC/EBs. (F) RNAi-mediated knockdown of Esg in ISC/EBs caused an accumulation of EE cells and a noticeable change in the morphology and size of some ISC/EBs (arrows in bottom panel; e.g. compare the large GFP+ cell identified by the rightmost arrow to its two smaller neighbors). Midguts from adults of the indicated genotypes were stained with DAPI (all nuclei), GFP (ISC/EB) and Pros (EE cells) following a 6-day incubation at 25°C on 10 μg/ml RU486 or EtOH-containing food (as indicated). (G) Images as those in (F) were processed with CellProfiler to quantify the relative proportion of EE cells in the indicated genotypes/treatments (see Materials and Methods for details). Each data point is an average proportion calculated from four independent images per midgut, and the bars are the geometric mean ± SEM of those averages. *** denotes a significant enrichment of EE cells following Esg knockdown in ISC/EBs compared to either control group (P < 0.001, Kruskal–Wallis/Dunn test).
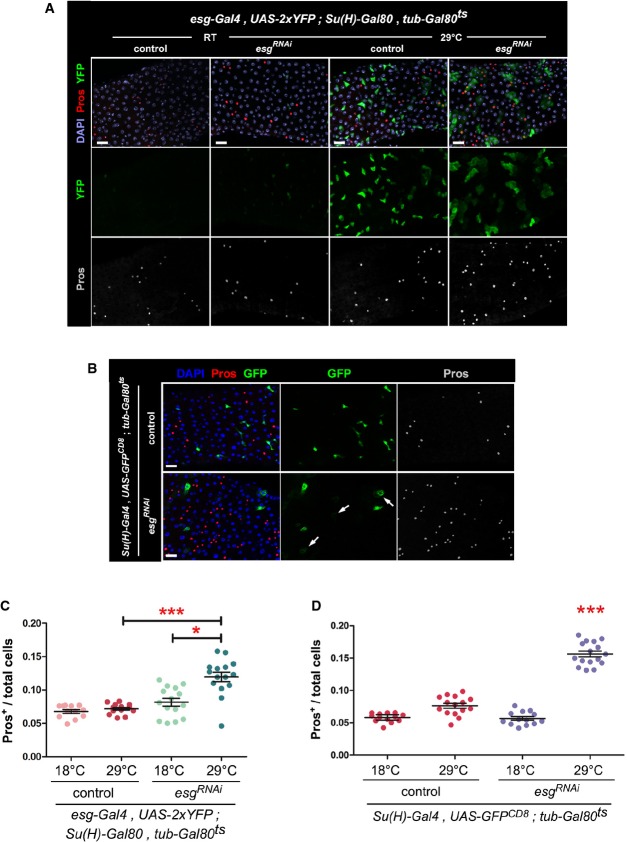
Phenotypes caused by depletion of esg in ISCs. Midguts of the indicated genotype were stained with DAPI (all nuclei), YFP (primarily ISCs) and Pros (EE cells) following 6 days of incubation at the indicated temperatures (control = outcross to w1118 flies).
Phenotypes caused by depletion of esg in EBs. Midguts of the indicated genotypes were stained with DAPI (all nuclei), GFP (EBs) and Pros (EE cells) following 6 days of incubation at 29°C to allow the EB-restricted expression of UAS-esgRNAi or a UAS-GFPnls (control). Notice the stronger nuclear GFP staining in control samples due to GFPnls expression. Arrows point to examples of EBs with a wider cytoplasm, dimmer GFP staining and seemingly polyploid nuclei following Esg knockdown.
EE cell accumulation induced by depletion of esg in ISCs. CellProfiler was used as in Fig1G to quantify the relative proportions of EE cells in midguts in images as those in (A). *** and * denote a statistically significant difference in the relative proportion of EE cells in pairwise post-test comparisons indicated by the corresponding bars (P < 0.001 and P < 0.05 Kruskal–Wallis/Dunn test).
EE cell accumulation induced by depletion of esg in EBs. CellProfiler was used as in (C). *** denotes a statistically significant accumulation of EE cells following EB-specific Esg knockdown, as compared to all other samples (P < 0.001, Kruskal–Wallis/Dunn test).
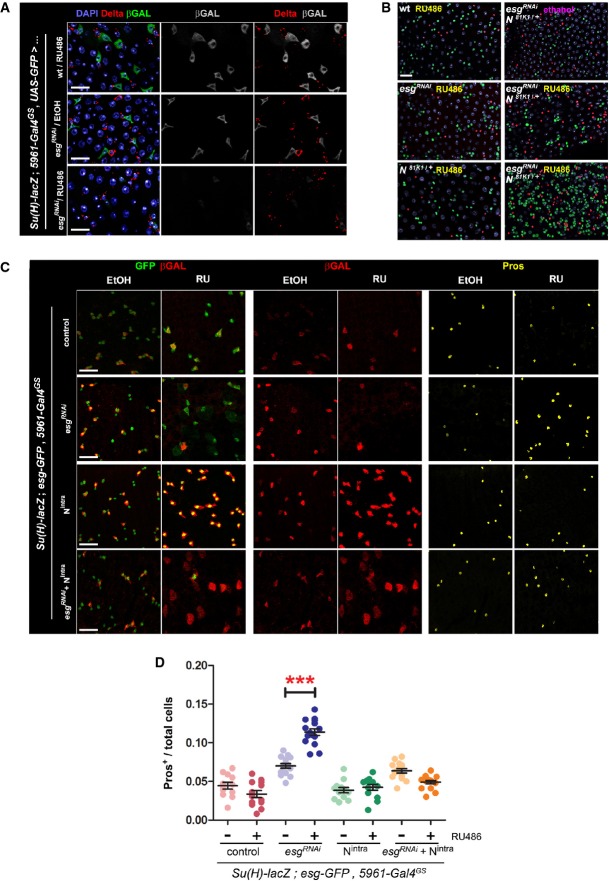
A Esg knockdown in ISC/EBs causes reduced Notch reporter activity in EBs. Use of a Notch (N) activity reporter (Su(H)-lacZ; Bray & Furriols, 2001) reveals a noticeable reduction in N signaling within EBs, despite of seemingly unaltered Delta expression in ISCs. Midguts of the indicated genotypes were stained with DAPI (all nuclei), Delta (ISCs) and β-GAL (EBs) following 4 days of incubation in 10 μg RU486/ml or ethanol-containing food as indicated.
B Epistasis analysis between Esg (esgRNAi) and Notch (N81K1). Midguts of the indicated genotypes were stained with DAPI (all nuclei), GFP (esg+ cells) and Pros (EE cells) following 6 days of incubation in 5 μg/ml RU or ethanol, as indicated. Notice that a lower concentration of RU486, resulting in a more moderate induction of esgRNAi expression, did not produce the larger and dimmer GFP+ nuclei or EE cell accumulation typically observed with higher doses of RU486. Approximately 83% (15/18) of the N81K1/+; esgRNAi guts showed a noticeable accumulation of EE cells in an otherwise normal-looking epithelium (right column, middle panel), whereas the remaining 17% showed a drastic expansion of diploid, esg+ and EE cells (right column, lower panel), reminiscent of stronger Notch loss-of-function mutations (compare with Supplementary Fig S3B).
C, D Constitutively active Notch signaling rescues the EE cell enrichment phenotype caused by Esg knockdown. (C) An esgRNAi construct and a constitutively active Notch construct (Nintra) were expressed alone or in combination in ISC/EBs using the 5961GS driver. Midguts of the indicated genotypes were stained for GFP, β-GAL (EBs) and Pros (EE cells) following 7 days of incubation in ethanol or 25 μg/ml RU486 as indicated. (D) Images as those in (C) were processed with CellProfiler to quantify the relative proportion of EE cells. Midguts overexpressing the esgRNAi construct alone were the only sample that showed a significant EE enrichment relative to the corresponding EtOH control (***P < 0.001, one-way ANOVA/Bonferroni test).
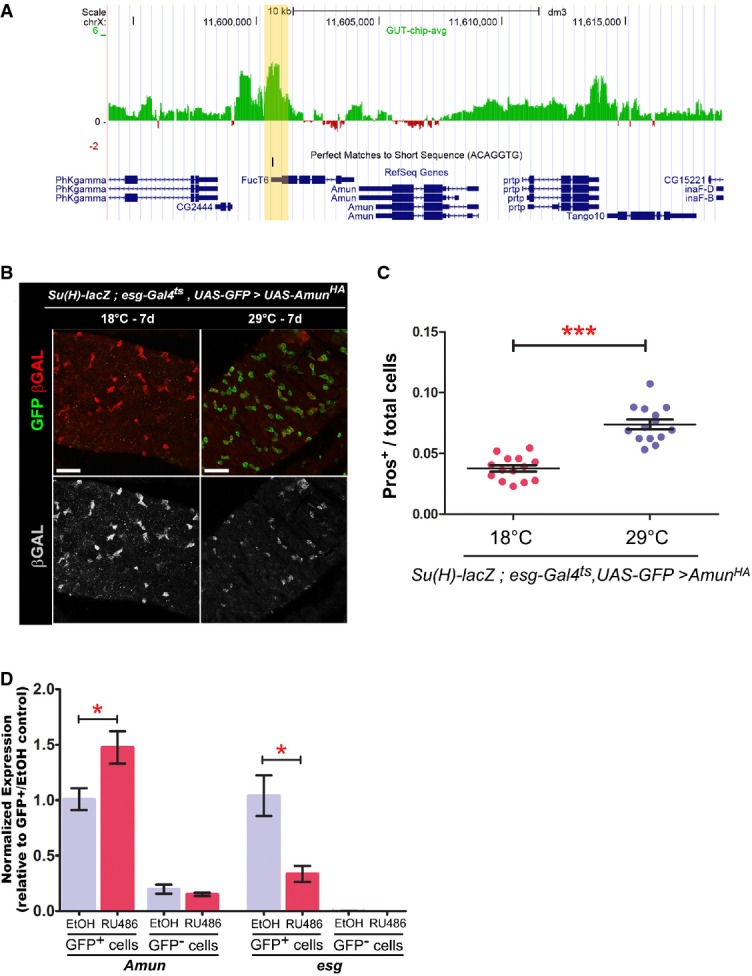
A Esg DamID profile surrounding the Amun locus. Data are displayed as custom UCSC Genome Browser tracks. Green/red bars represent the average log2 (intensity ratio) between the Esg:Dam and Dam-control samples, mapped to the genomic regions ± 10 kb from Amun (see Supplementary Materials and Methods for further details). The yellow shading highlights an Esg-bound region (EBR), which includes a consensus Esg E-box ([G/A]CAGGTG; Fuse et al, 1994).
B, C Amun overexpression in ISC/EBs resembles a reduction in N signalling. (B) Midguts of the indicated genotype were stained with DAPI (nuclei), GFP (ISC/EB) and β-GAL (N activation). (C) CellProfiler quantification of the relative proportion of EE cells in midguts from (B). A similar result was obtained using the milder 5961GS driver (Supplementary Fig S4). ***P < 0.001, Mann–Whitney U-test. Scale bars = 20 μm.
D Amun mRNA upregulation following Esg knockdown in ISC/EBs. qPCR measurements of relative transcript abundances for the indicated genes from esg-GFP+ and esg-GFP− cells isolated by FACS sorting from esg-GFP, 5961GS > UAS-esgRNAi flies incubated on ethanol or RU486 (25 μg/ml for 3 days) to induce RNAi expression. Shown are means (± SEM) of efficiency-corrected relative quantities for each primer set, normalized to the corresponding GFP+/EtOH sample and to RpL32 levels (used as reference). * denotes a significant reduction in esg and an increase in Amun transcript levels, respectively (P < 0.05, two-tailed unpaired Student's t-test).
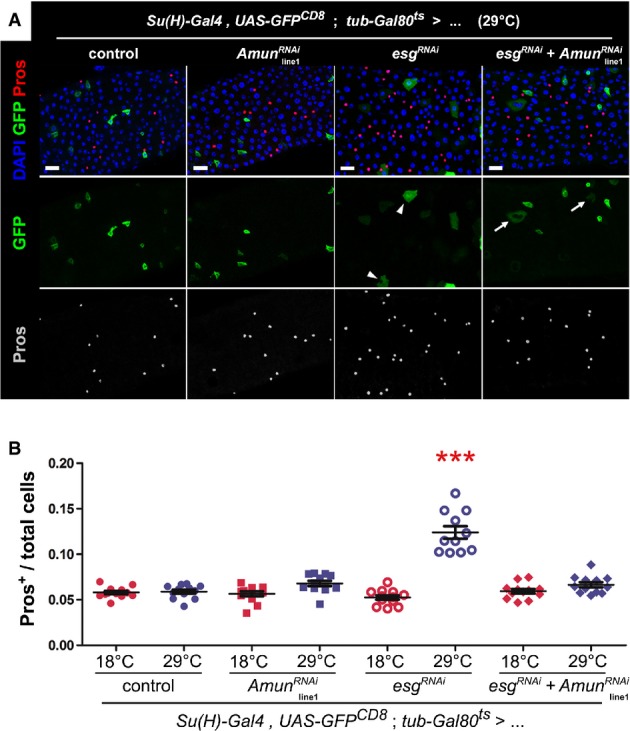
Immunostaining of midguts following EB-restricted co-downregulation of Amun and esg. Midguts from flies of the indicated genotypes were incubated for 6 days at 29°C and stained for DAPI (all nuclei), GFP (EBs) and Pros (EE cells). “Control” = the Su(H)ts driver stock outcrossed to wild-type flies. The AmunRNAi construct shown is inserted on chromosome II (“line1”; Supplementary Fig S6A and B shows the same experiment with an independent insertion of the same AmunRNAi construct on chromosome X, or “line2”). The esgRNAi flies also carry a UAS-GFPnls construct in the background (to control for GAL4 titration), which explains the nuclear GFP staining of EBs in these midguts. Notice that the alterations in EB morphology caused by Esg knockdown (arrowheads) are only partially rescued by the co-expression of AmunRNAi (arrows; see also Supplementary Fig S6A). Scale bars = 20 μm.
Abrogation of EE cell enrichment by co-downregulation of Esg and Amun. CellProfiler was used to quantify relative EE cell proportions (as before). Genotype-matched controls were kept for 10–11 days at 18°C. *** denotes the only sample that was significantly different from all other samples in the set, including its genotype match at 18°C (P < 0.001, one-way ANOVA/Bonferroni test).
Comment in
-
Gut stem cells, a story of snails, flies and mice.EMBO J. 2015 May 12;34(10):1287-9. doi: 10.15252/embj.201591541. Epub 2015 Apr 11. EMBO J. 2015. PMID: 25863942 Free PMC article.
References
Publication types
MeSH terms
Substances
Grants and funding
LinkOut - more resources
Full Text Sources
Other Literature Sources
Medical
Molecular Biology Databases
Research Materials
