In vitro exposure to the herbicide atrazine inhibits T cell activation, proliferation, and cytokine production and significantly increases the frequency of Foxp3+ regulatory T cells
- PMID: 25433234
- PMCID: PMC4306722
- DOI: 10.1093/toxsci/kfu242
In vitro exposure to the herbicide atrazine inhibits T cell activation, proliferation, and cytokine production and significantly increases the frequency of Foxp3+ regulatory T cells
Abstract
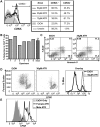
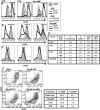
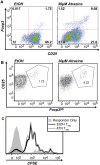
The herbicide atrazine (2-chloro-4-[ethylamino]-6-[isopropylamino]-s-triazine) is the most common water contaminant in the United States. Atrazine is a phosphodiesterase inhibitor and is classified as an estrogen disrupting compound because it elevates estrogen levels via induction of the enzyme aromatase. Previous studies have shown that atrazine exposure alters the function of innate immune cells such as NK cells, DC, mast cells, and macrophages. In this study we have examined the impact of in vitro atrazine exposure on the activation, proliferation, and effector cytokine production by primary murine CD4(+) T lymphocytes. We found that atrazine exposure significantly inhibited CD4(+) T cell proliferation and accumulation as well as the expression of the activation markers CD25 and CD69 in a dose-dependent manner. Interestingly, the effects were more pronounced in cells from male animals. These effects were partially mimicked by pharmacological reagents that elevate intracellular cAMP levels and addition of exogenous rmIL-2 further inhibited proliferation and CD25 expression. Consistent with these findings, atrazine exposure during T cell activation resulted in a 2- to 5-fold increase in the frequency of Foxp3(+) CD4(+) T cells.
Keywords: CD4+ T cell; Foxp3; atrazine; cAMP; regulatory T cells.
© The Author 2014. Published by Oxford University Press on behalf of the Society of Toxicology. All rights reserved. For Permissions, please e-mail: journals.permissions@oup.com.
Figures


Similar articles
-
In-vitro generation and characterisation of murine CD4+CD25+ regulatory T cells with indirect allospecificity.Int Immunopharmacol. 2006 Dec 20;6(13-14):1883-8. doi: 10.1016/j.intimp.2006.07.032. Epub 2006 Sep 1. Int Immunopharmacol. 2006. PMID: 17161341
-
Natural killer cells prevent CD28-mediated Foxp3 transcription in CD4+CD25- T lymphocytes.Exp Hematol. 2007 Mar;35(3):416-25. doi: 10.1016/j.exphem.2006.12.004. Exp Hematol. 2007. PMID: 17309822
-
[Proliferation of CD4+ CD25+ regulatory T cells of rat by different cytokines in vitro].Zhonghua Yi Xue Za Zhi. 2008 Mar 25;88(12):844-7. Zhonghua Yi Xue Za Zhi. 2008. PMID: 18756991 Chinese.
-
Defects in IL-2R signaling contribute to diminished maintenance of FOXP3 expression in CD4(+)CD25(+) regulatory T-cells of type 1 diabetic subjects.Diabetes. 2010 Feb;59(2):407-15. doi: 10.2337/db09-0694. Epub 2009 Oct 29. Diabetes. 2010. PMID: 19875613 Free PMC article.
-
Immunotoxic effects of short-term atrazine exposure in young male C57BL/6 mice.Toxicol Sci. 2005 Aug;86(2):324-32. doi: 10.1093/toxsci/kfi188. Epub 2005 May 11. Toxicol Sci. 2005. PMID: 15888671
Cited by
-
Toxic effects of atrazine on porcine oocytes and possible mechanisms of action.PLoS One. 2017 Jun 22;12(6):e0179861. doi: 10.1371/journal.pone.0179861. eCollection 2017. PLoS One. 2017. PMID: 28640859 Free PMC article.
-
Imbalance of human CD4+ T lymphocyte subsets following atrazine treatment.Arch Toxicol. 2025 Apr;99(4):1455-1469. doi: 10.1007/s00204-025-03974-9. Epub 2025 Mar 2. Arch Toxicol. 2025. PMID: 40025135 Free PMC article.
-
Assessing in vitro and in vivo Trogocytosis By Murine CD4+ T cells.Bio Protoc. 2020 May 5;10(9):e3607. doi: 10.21769/BioProtoc.3607. eCollection 2020 May 5. Bio Protoc. 2020. PMID: 33659572 Free PMC article.
-
A novel mechanism underlies atrazine toxicity in quails (Coturnix Coturnix coturnix): triggering ionic disorder via disruption of ATPases.Oncotarget. 2016 Dec 20;7(51):83880-83892. doi: 10.18632/oncotarget.13794. Oncotarget. 2016. PMID: 27924060 Free PMC article.
-
Endocrine Disruptor Compounds-A Cause of Impaired Immune Tolerance Driving Inflammatory Disorders of Pregnancy?Front Endocrinol (Lausanne). 2021 Apr 12;12:607539. doi: 10.3389/fendo.2021.607539. eCollection 2021. Front Endocrinol (Lausanne). 2021. PMID: 33912131 Free PMC article. Review.
References
-
- Averill L. E., Stein R. L., Kammer G. M. (1988). Control of human T-lymphocyte interleukin-2 production by a cAMP-dependent pathway. Cell Immunol. 115, 88–99. - PubMed
-
- Bazhin A. V., Kahnert S., Kimpfler S., Schadendorf D., Umansky V. (2010). Distinct metabolism of cyclic adenosine monophosphate in regulatory and helper CD4+ T cells. Mol. Immunol. 47, 678–684. - PubMed
-
- Bexfield L. M. (2008). Decadal-scale changes of pesticides in ground water of the United States, 1993-2003. J. Environ. Qual. 37, S226–S239. - PubMed
-
- Bodor J., Fehervari Z., Diamond B., Sakaguchi S. (2007). ICER/CREM-mediated transcriptional attenuation of IL-2 and its role in suppression by regulatory T cells. Eur. J. Immunol. 37, 884–895. - PubMed
Publication types
MeSH terms
Substances
Grants and funding
LinkOut - more resources
Full Text Sources
Other Literature Sources
Research Materials

