

How and why overcome the impediments to resolution: lessons from rhinolophid and hipposiderid bats
- PMID: 25433366
- PMCID: PMC4769323
- DOI: 10.1093/molbev/msu329
How and why overcome the impediments to resolution: lessons from rhinolophid and hipposiderid bats
Abstract
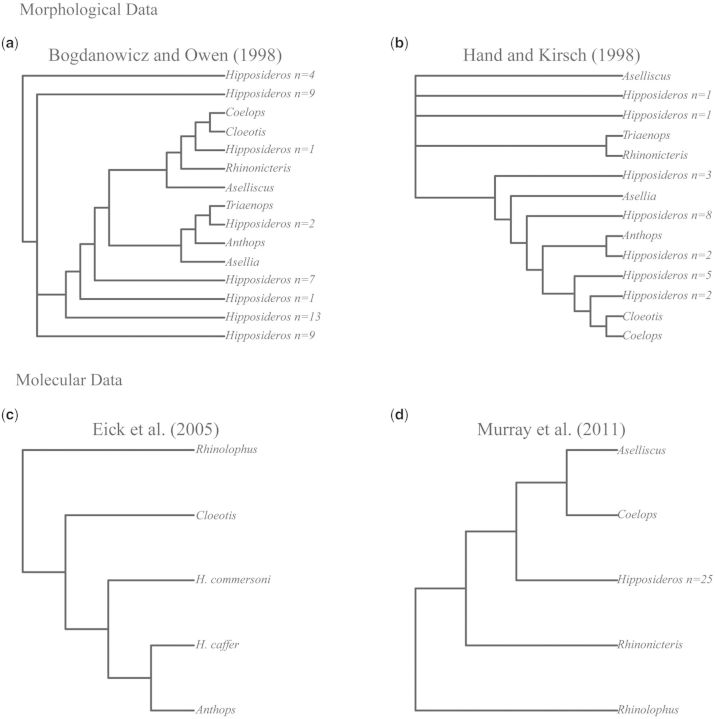
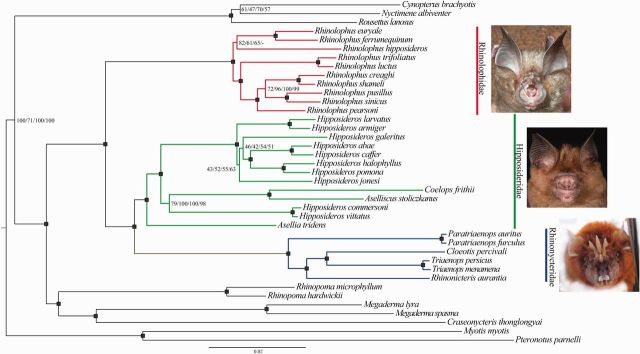
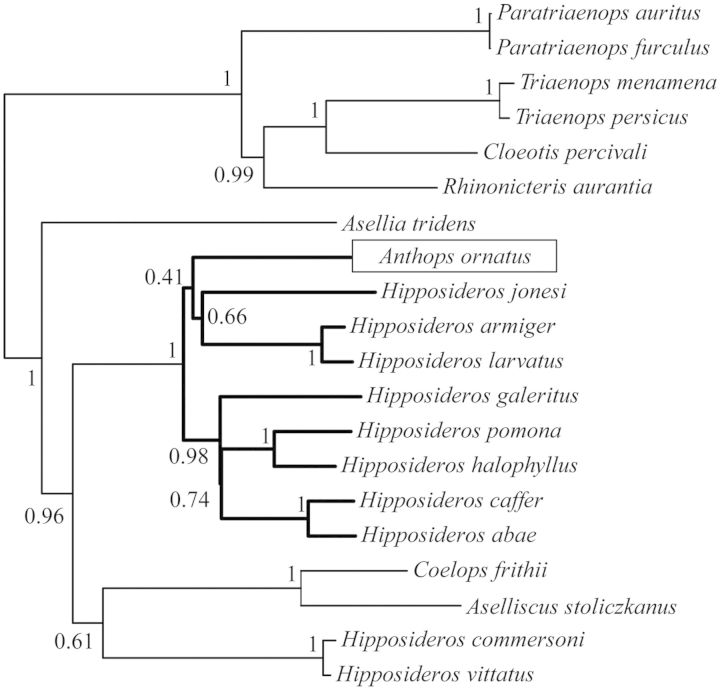
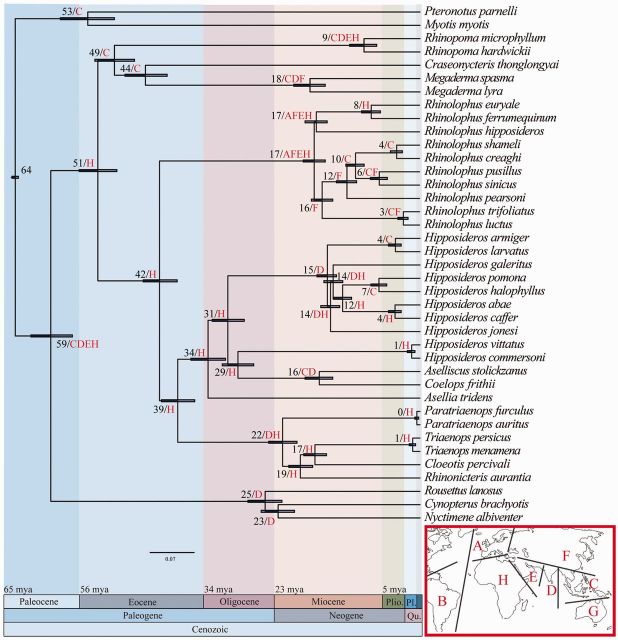
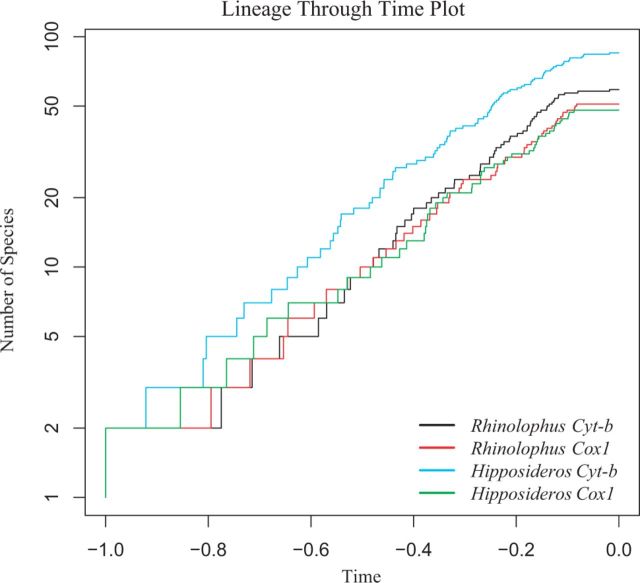
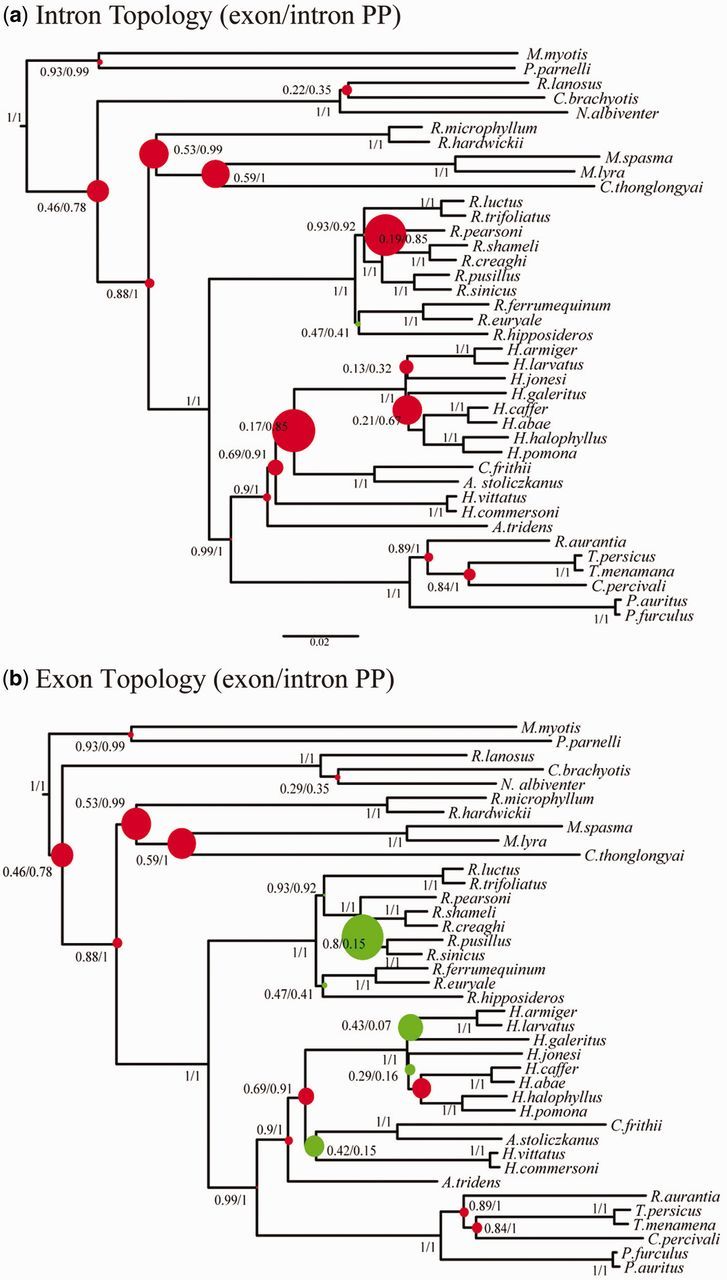
The phylogenetic and taxonomic relationships among the Old World leaf-nosed bats (Hipposideridae) and the closely related horseshoe bats (Rhinolophidae) remain unresolved. In this study, we generated a novel approximately 10-kb molecular data set of 19 nuclear exon and intron gene fragments for 40 bat species to elucidate the phylogenetic relationships within the families Rhinolophidae and Hipposideridae. We estimated divergence times and explored potential reasons for any incongruent phylogenetic signal. We demonstrated the effects of outlier taxa and genes on phylogenetic reconstructions and compared the relative performance of intron and exon data to resolve phylogenetic relationships. Phylogenetic analyses produced a well-resolved phylogeny, supporting the familial status of Hipposideridae and demonstrated the paraphyly of the largest genus, Hipposideros. A fossil-calibrated timetree and biogeographical analyses estimated that Rhinolophidae and Hipposideridae diverged in Africa during the Eocene approximately 42 Ma. The phylogram, the timetree, and a unique retrotransposon insertion supported the elevation of the subtribe Rhinonycterina to family level and which is diagnosed herein. Comparative analysis of diversification rates showed that the speciose genera Rhinolophus and Hipposideros underwent diversification during the Mid-Miocene Climatic Optimum. The intron versus exon analyses demonstrated the improved nodal support provided by introns for our optimal tree, an important finding for large-scale phylogenomic studies, which typically rely on exon data alone. With the recent outbreak of Middle East respiratory syndrome, caused by a novel coronavirus, the study of these species is urgent as they are considered the natural reservoir for emergent severe acute respiratory syndrome (SARS)-like coronaviruses. It has been shown that host phylogeny is the primary factor that determines a virus's persistence, replicative ability, and can act as a predictor of new emerging disease. Therefore, this newly resolved phylogeny can be used to direct future assessments of viral diversity and to elucidate the origin and development of SARS-like coronaviruses in mammals.
Keywords: Rhinonycteridae; biogeography; exon versus intron; mammals; phylogenetics; virus.
© The Author 2014. Published by Oxford University Press on behalf of the Society for Molecular Biology and Evolution. All rights reserved. For permissions, please e-mail: journals.permissions@oup.com.
Figures
References
-
- Amit M, Donyo M, Hollander D, Goren A, Kim E, Gelfman S, Lev-Maor G, Burstein D, Schwartz S, Postolsky B. Differential GC content between exons and introns establishes distinct strategies of splice-site recognition. Cell Rep. 2012;1:543–556. - PubMed
-
- Armstrong KN. Resolving the correct nomenclature of the orange leaf-nosed bat Rhinonicteris aurantia (Gray, 1845)(Hipposideridae) Aust Mammal. 2006;28:125–130.
-
- Balboni A, Battilani M, Prosperi S. The SARS-like coronaviruses: the role of bats and evolutionary relationships with SARS coronavirus. New Microbiol. 2012;35:1–16. - PubMed
Publication types
MeSH terms
LinkOut - more resources
Full Text Sources
Other Literature Sources
Miscellaneous
